MapViewer is a new tool for viewing genetic maps on CottonGen. It can be accessed from multiple locations including the Tools header menu (Fig. 34A) and in the Tools section of Species Overview pages (Fig. 34B). From the MapViewer main page, clicking Sample Map will bring up a default map display that can be adjusted as described below.
.jpg)
Figure 34. Accessing MapViewer in CottonGen.
It can also be accessed via Search Map in the Search header menu (Fig. 35A) and then choosing the desired map. The Map Overview page displays a summary graphic of all linkage groups (Fig. 35B) and clicking a linkage group opens a detailed view in MapViewer.
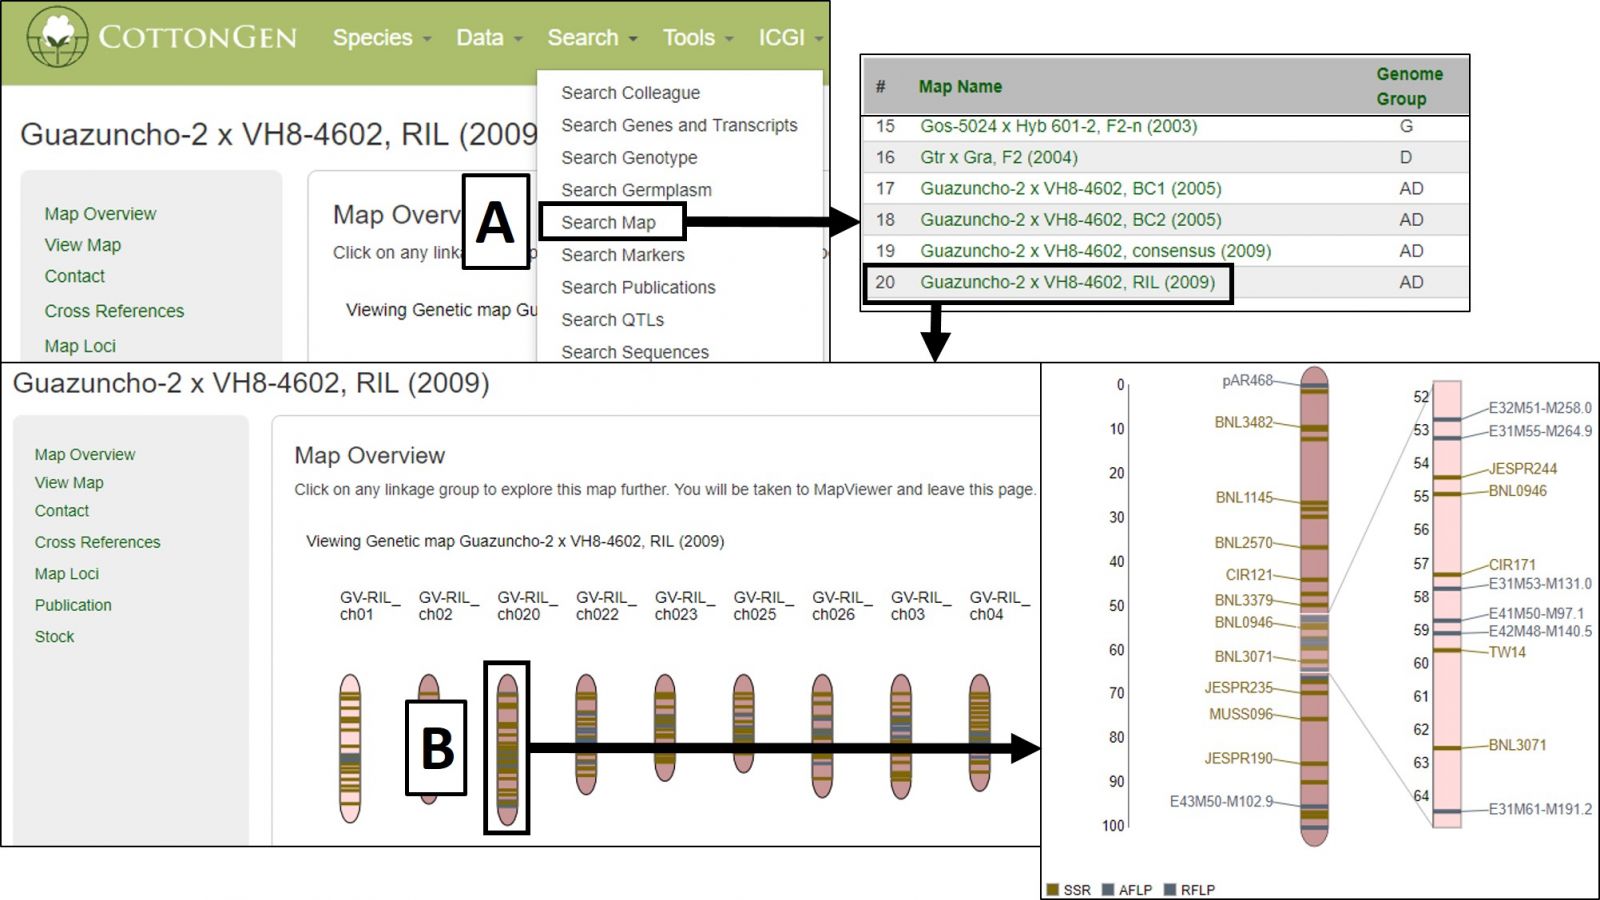
Figure 35. Accessing and using MapViewer in CottonGen.
MapViewer displays the complete linkage group on the left and a highlighted region on the right (Fig. 36). This region can be changed by clicking and dragging on the linkage group over the desired area. There is a legend for the marker colors in the bottom left corner (Fig. 36A). Information about a marker is displayed when the cursor is over its name in the highlighted region (Fig. 36B) and clicking that name will open the marker's Overview page. Displayed markers can be hidden or shown based on marker type, and their highlight colors changed, using the Display Settings at the bottom of the page (Fig. 36C).
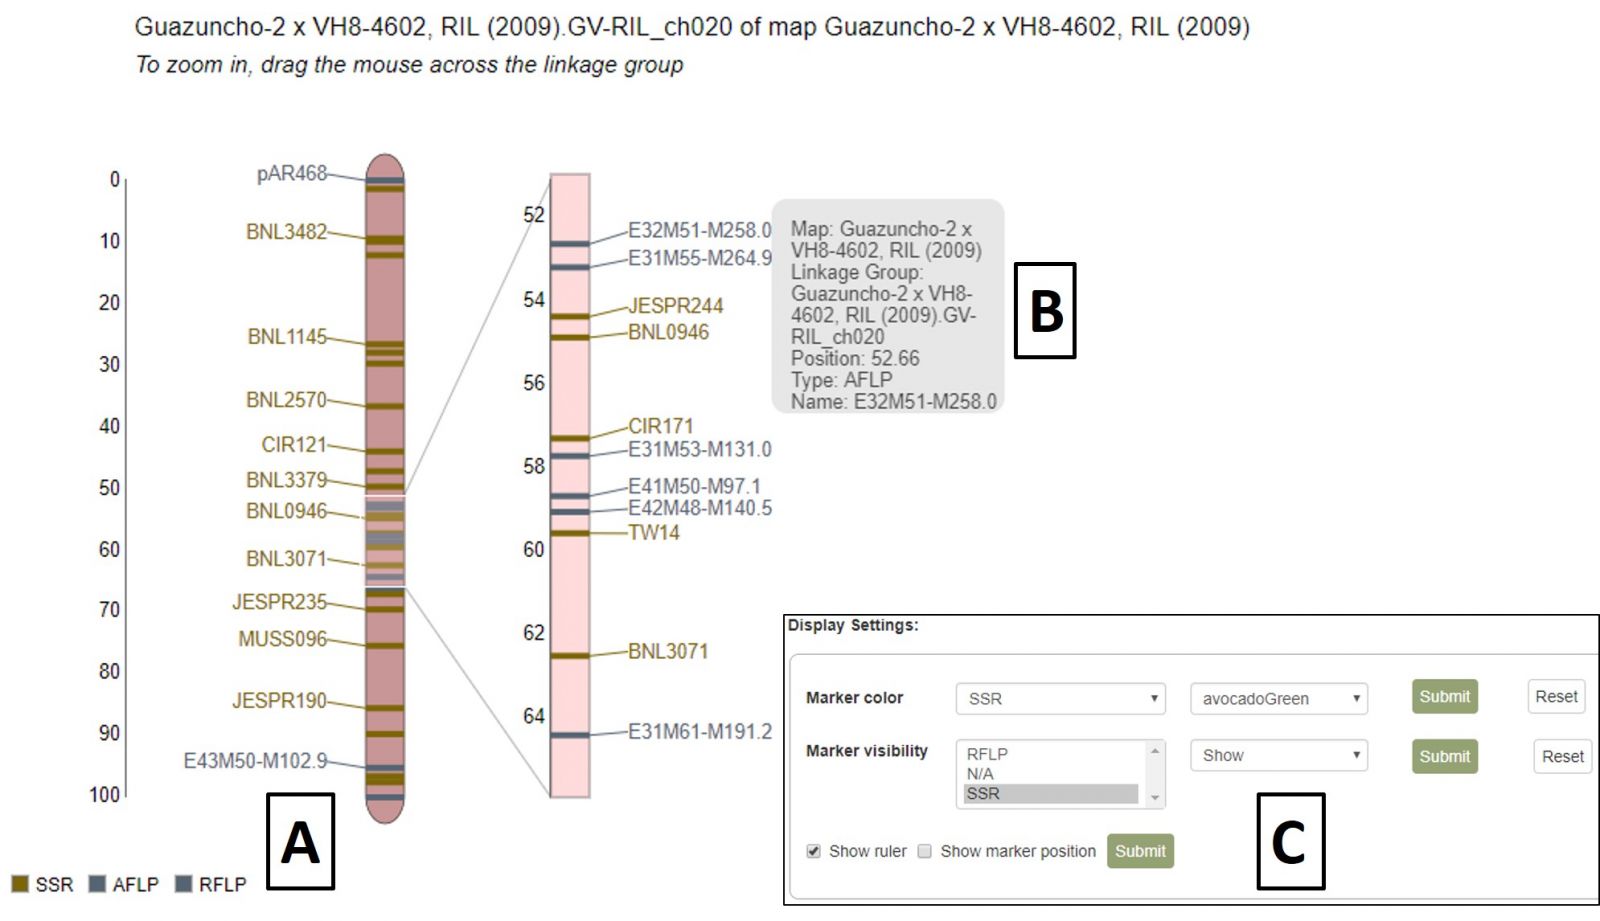
Figure 36. MapViewer static linkage group (left) and dynamic highlight region (right).
A different map or linkage group can be displayed using the controls at the bottom of the MapViewer page (Fig. 37A). When changing the broader categories of Species or Map, the website will take a moment to update the available selections in the subcategories. After changing map selections, the Submit button must be pressed to update the display. MapViewer can also display a comparison map alongside your original selection by checking the "Show comparison map" box (Fig. 37B) and selecting the desired map and linkage group.
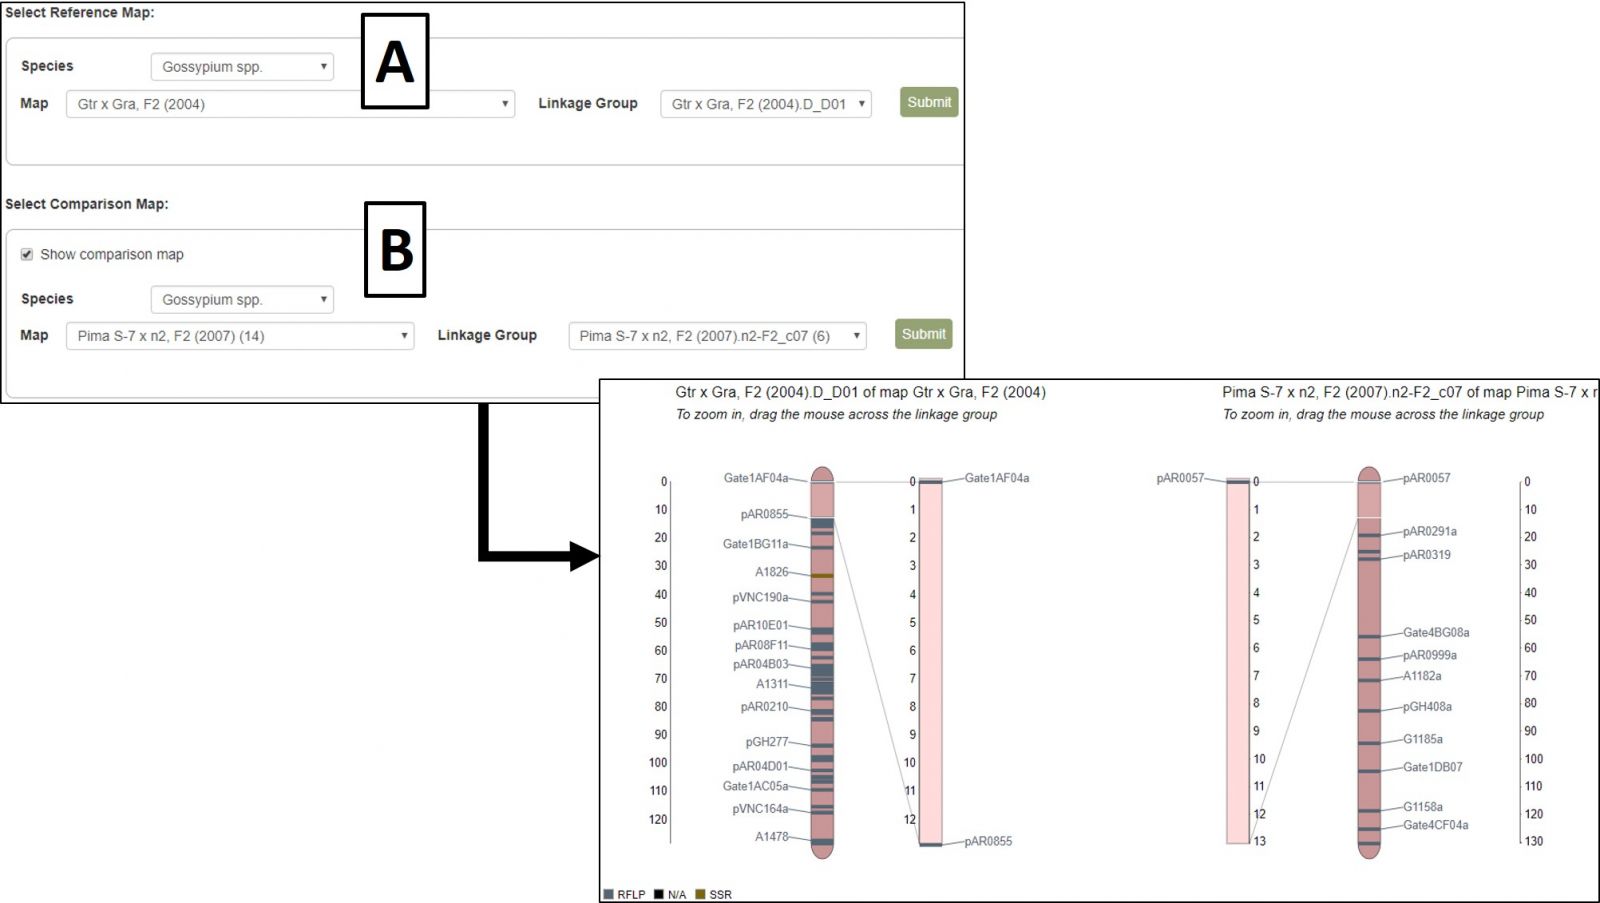
Figure 37. Changing map/linkage group and displaying comparison maps in MapViewer.