Tools
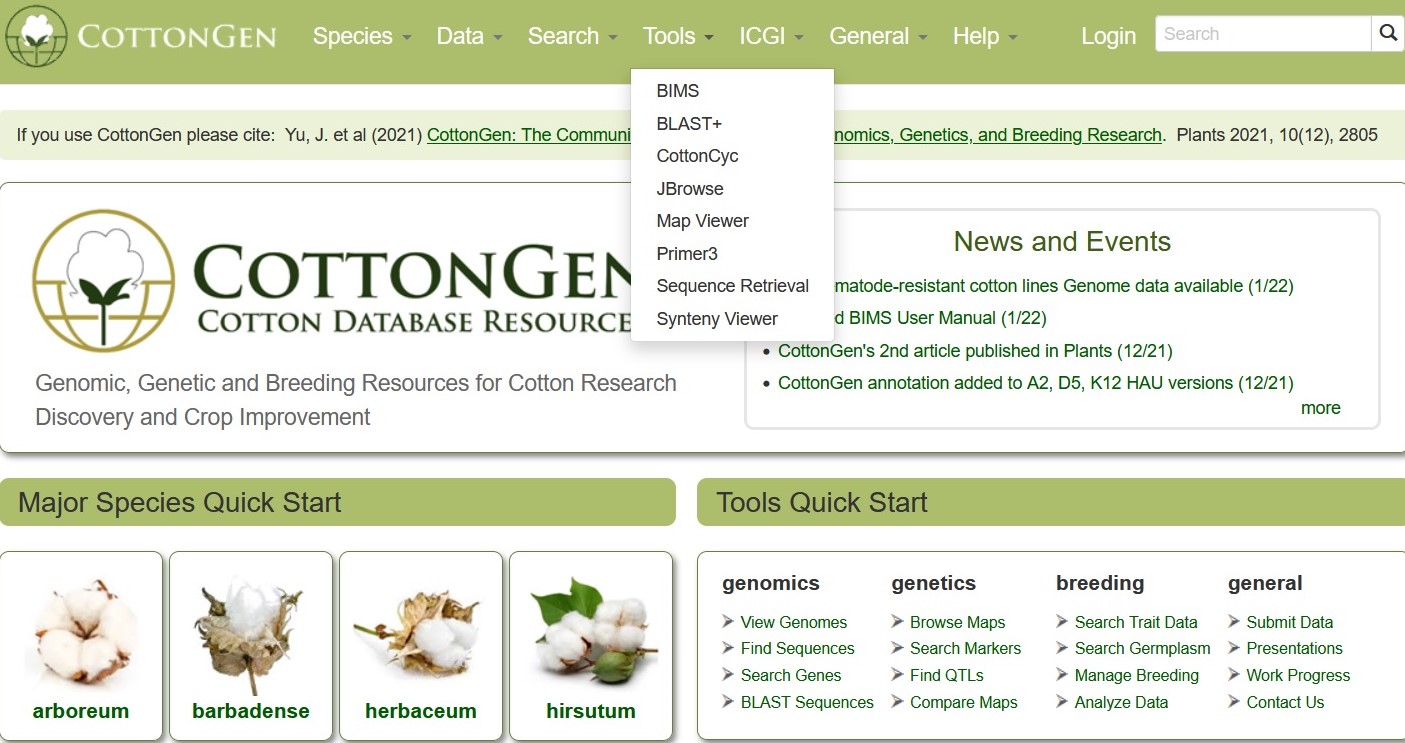
To access the different Tools available on CottonGen, click on the 'tools' menu in the header and then select the tool you want to use. Many of the tools are also quickly accessed through links in the 'Tools Quick Start' section on the CottonGen homepage. To learn more about each search tool, please see the links below the figure.
BLAST
CottonGen offers BLAST with genome, transcriptome, peptide and marker sequence databases from Gossypium species. This can be done using nucleotide sequences (Fig. 29A) or peptide sequences (Fig. 29B). BLAST functionality is similar to that on NCBI, and information on advanced settings can be found in the NCBI BLAST Help manual.
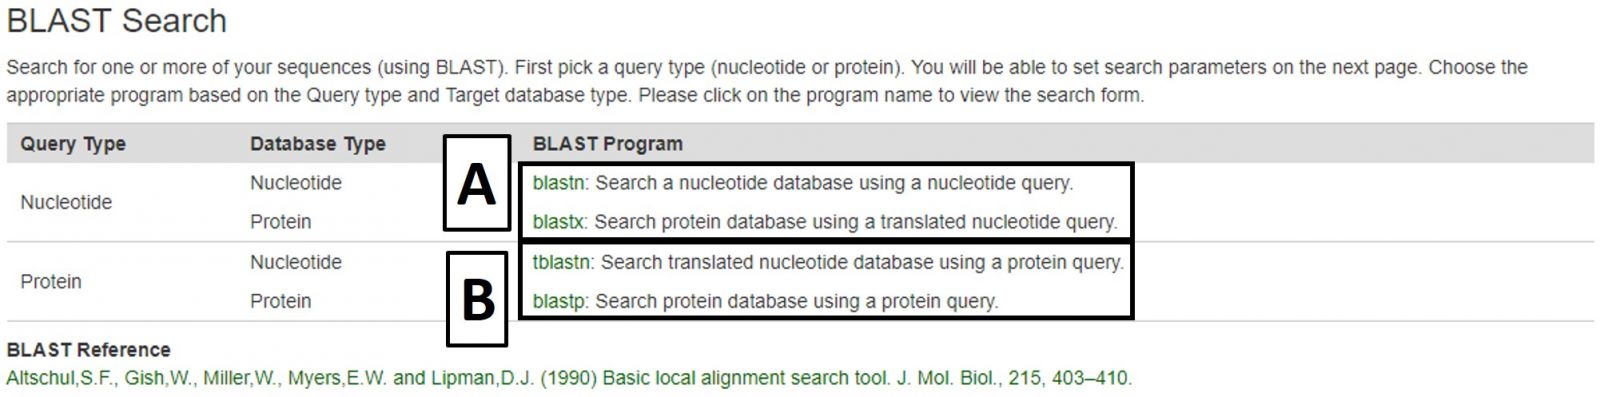
Figure 29. BLAST menu on CottonGen.
The new Tripal BLAST module displays results in an interactive interface where target hit alignment and quality can be viewed (Fig. 30A). Features that are in the CottonGen database will have links to their CottonGen entries where further information can be found (Fig. 30B), and alignments to genome scaffolds that are in CottonGen JBrowse will have links to JBrowse.
.jpg)
Figure 30. BLAST results in CottonGen.
CMap
CMap is used to view and compare genetic maps on CottonGen. CMap can be accessed via the Tools header menu. For more information on using CMap, view this tutorial.
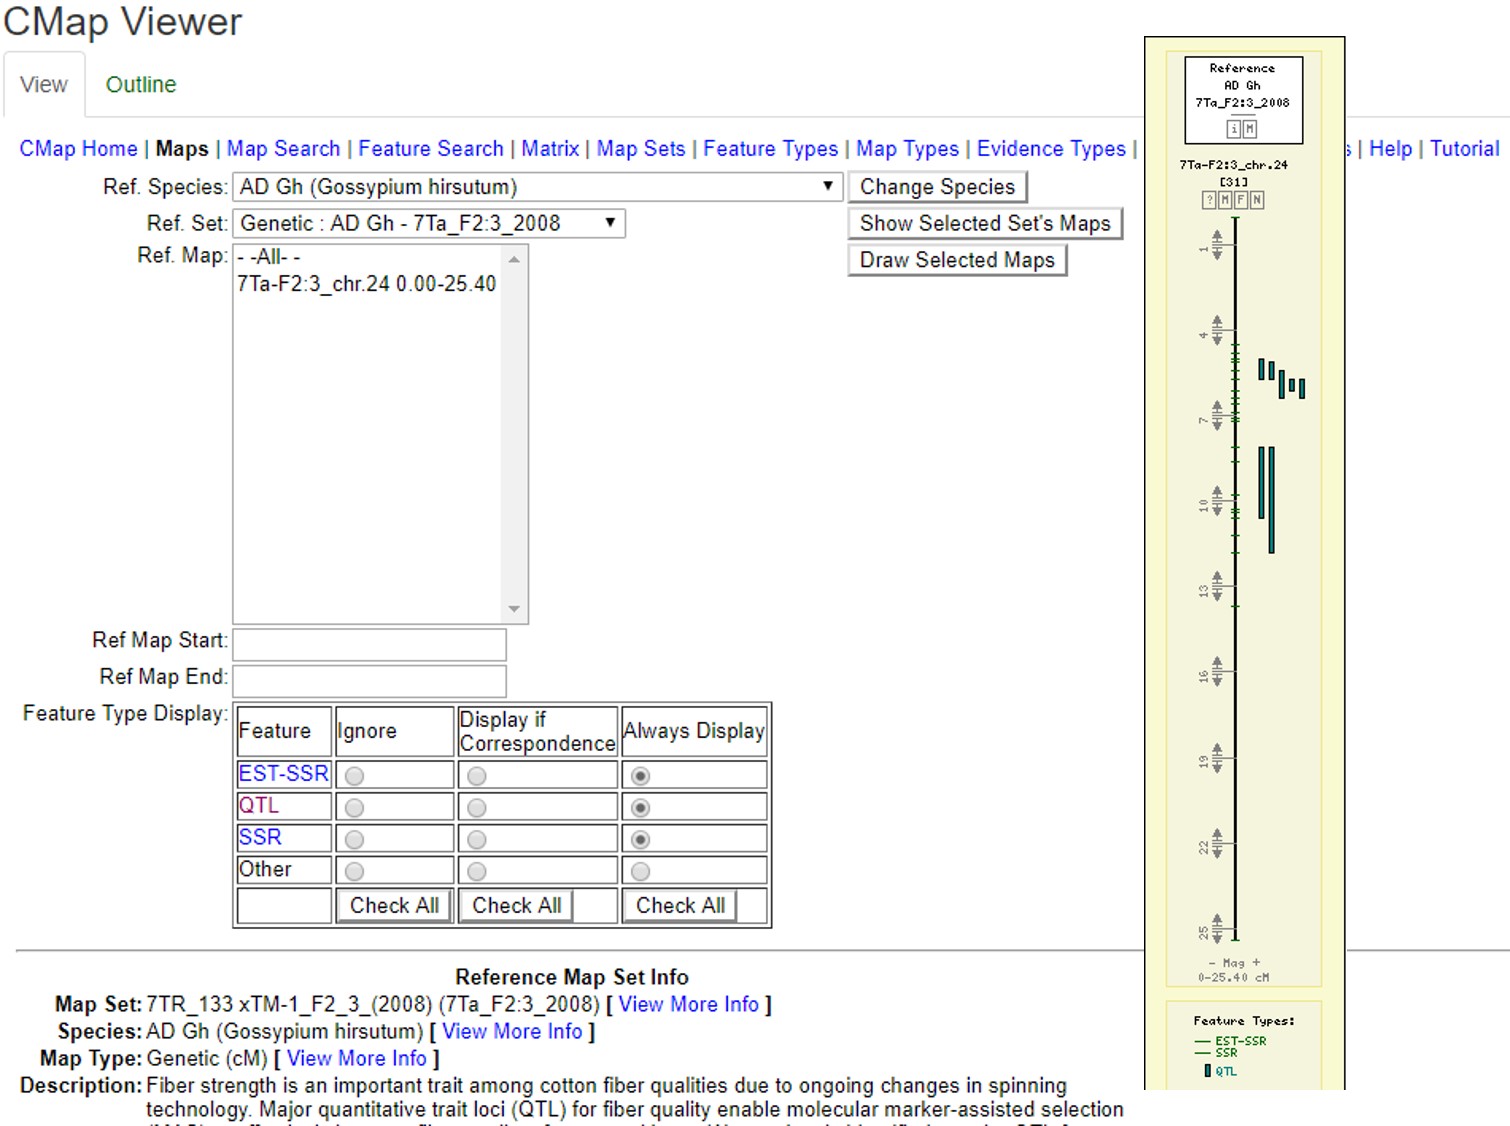
Figure 32. Examples of CMap interfaces on CottonGen.
CottonCyc
CottonCyc pathways were generated using Pathway Tools and are available under the CottonCyc link in the Tools menu. Pathway Tools allows users to view metabolic pathways based on specific genomes. Please see the User's Guide for Pathway Tools for more information on use.
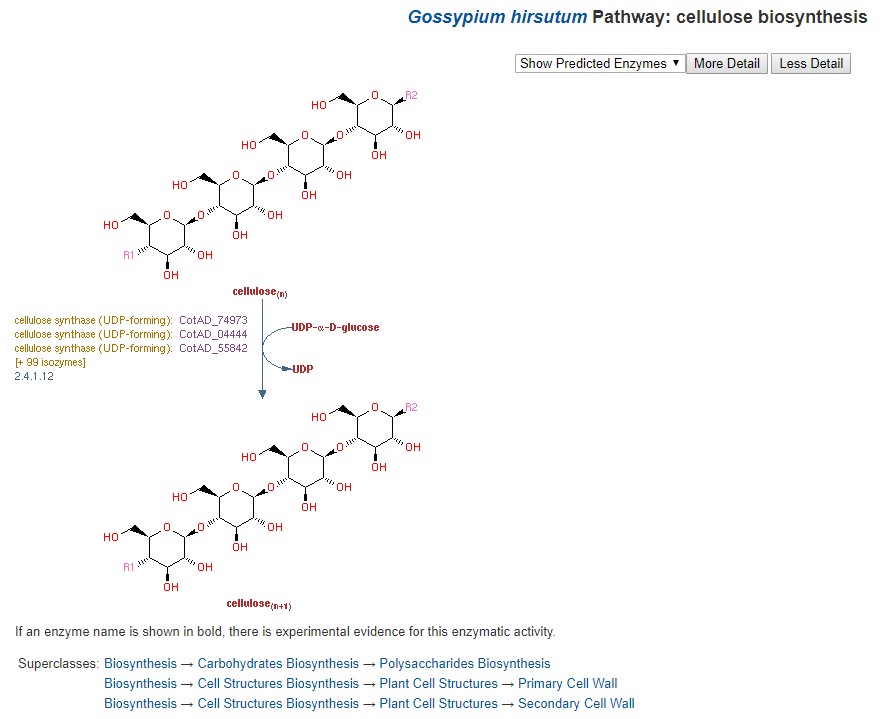
Figure 33. CottonCyc view of cellulose biosynthesis in G. hirsutum.
JBrowse
CottonGen has an instance of the JBrowse genome browser for viewing genome data (Fig. 31). A list of the genomes available in CottonGen can be accessed by clicking the JBrowse link in the Tools menu. Please watch the JBrowse tutorial for more details about how to navigate and use JBrowse.
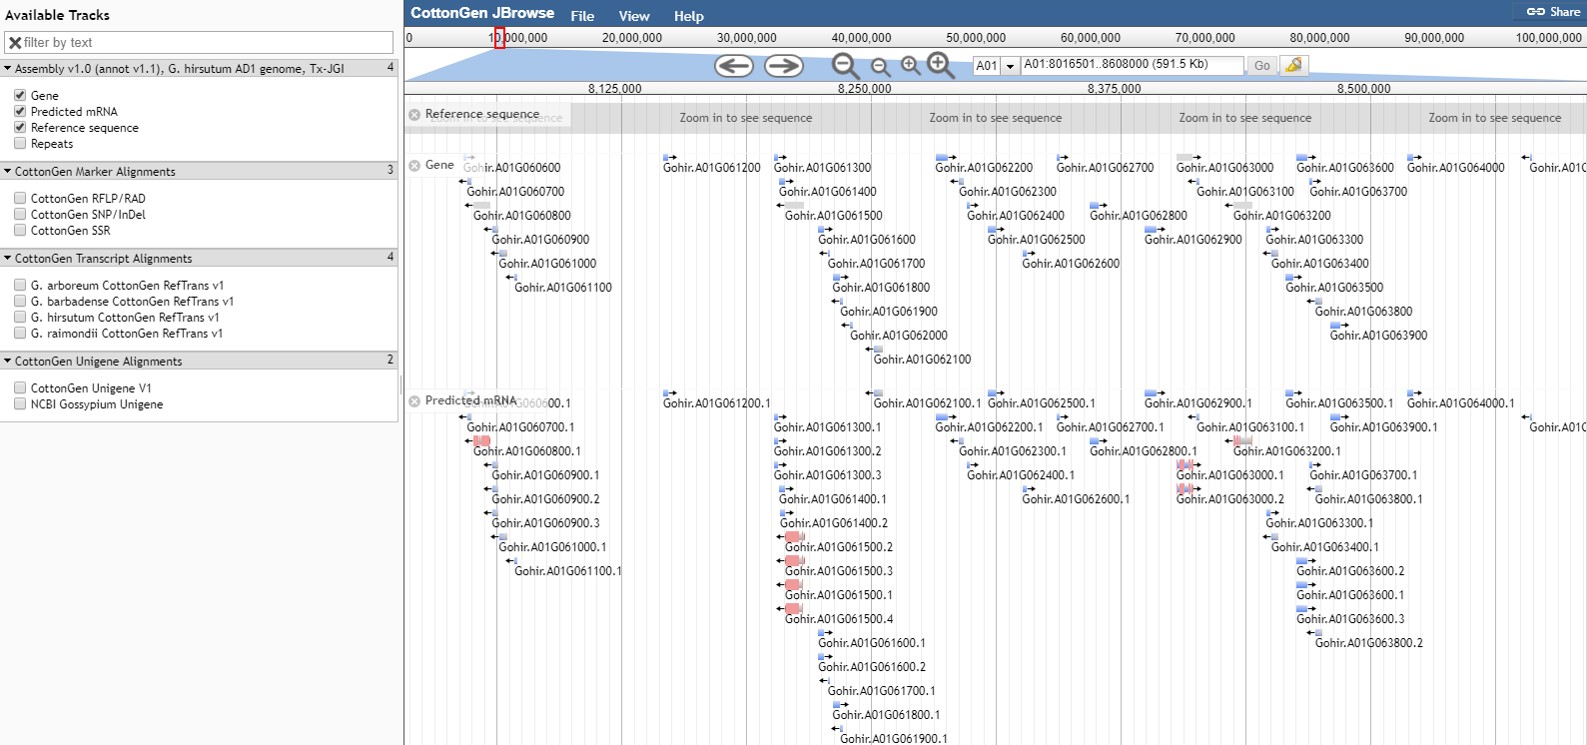
Figure 31. JBrowse view of G. hirsutum AD1 genome Tx-JGI assembly in CottonGen.
Read more about JBrowse and data format:
Map Viewer
MapViewer is a new tool for viewing genetic maps on CottonGen. It can be accessed from multiple locations including the Tools header menu (Fig. 34A) and in the Tools section of Species Overview pages (Fig. 34B). From the MapViewer main page, clicking Sample Map will bring up a default map display that can be adjusted as described below.
.jpg)
Figure 34. Accessing MapViewer in CottonGen.
It can also be accessed via Search Map in the Search header menu (Fig. 35A) and then choosing the desired map. The Map Overview page displays a summary graphic of all linkage groups (Fig. 35B) and clicking a linkage group opens a detailed view in MapViewer.
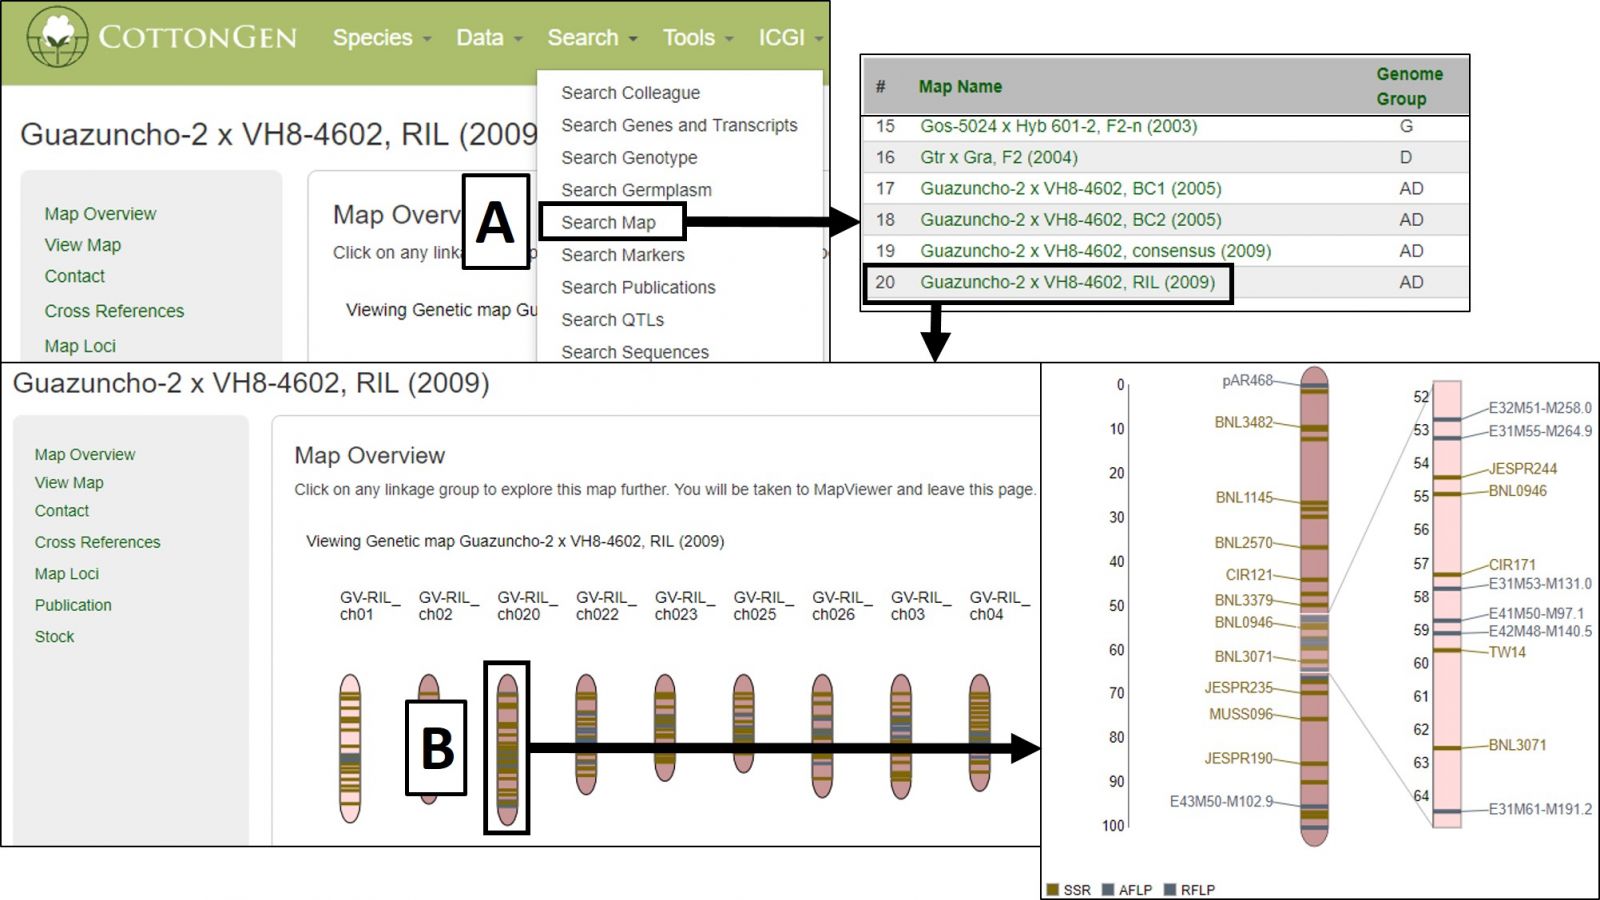
Figure 35. Accessing and using MapViewer in CottonGen.
MapViewer displays the complete linkage group on the left and a highlighted region on the right (Fig. 36). This region can be changed by clicking and dragging on the linkage group over the desired area. There is a legend for the marker colors in the bottom left corner (Fig. 36A). Information about a marker is displayed when the cursor is over its name in the highlighted region (Fig. 36B) and clicking that name will open the marker's Overview page. Displayed markers can be hidden or shown based on marker type, and their highlight colors changed, using the Display Settings at the bottom of the page (Fig. 36C).
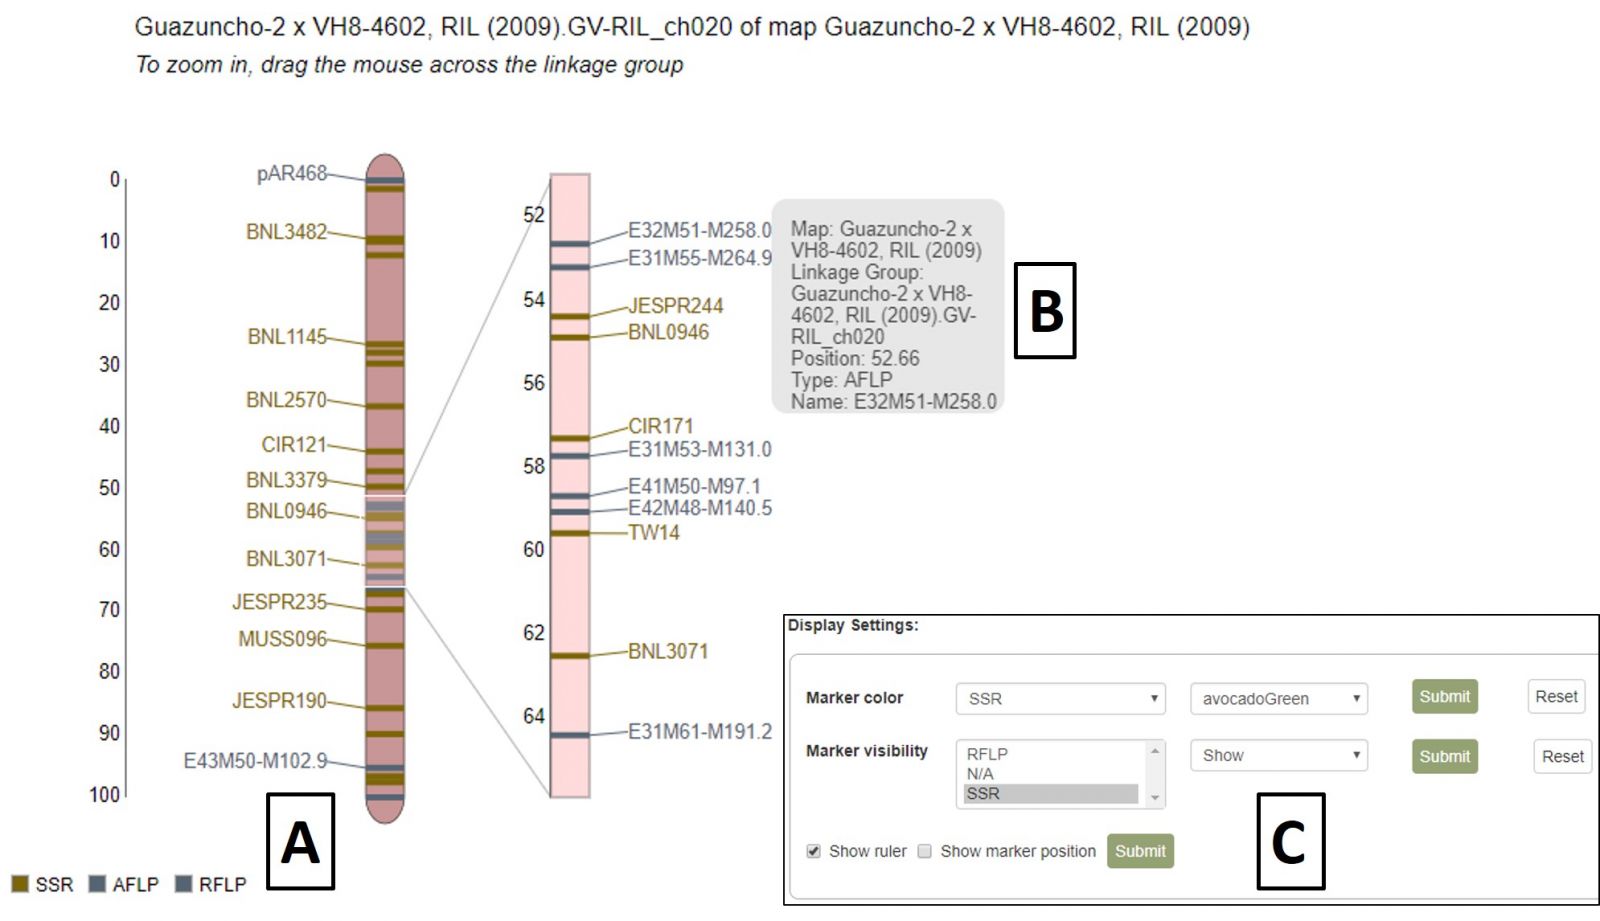
Figure 36. MapViewer static linkage group (left) and dynamic highlight region (right).
A different map or linkage group can be displayed using the controls at the bottom of the MapViewer page (Fig. 37A). When changing the broader categories of Species or Map, the website will take a moment to update the available selections in the subcategories. After changing map selections, the Submit button must be pressed to update the display. MapViewer can also display a comparison map alongside your original selection by checking the "Show comparison map" box (Fig. 37B) and selecting the desired map and linkage group.
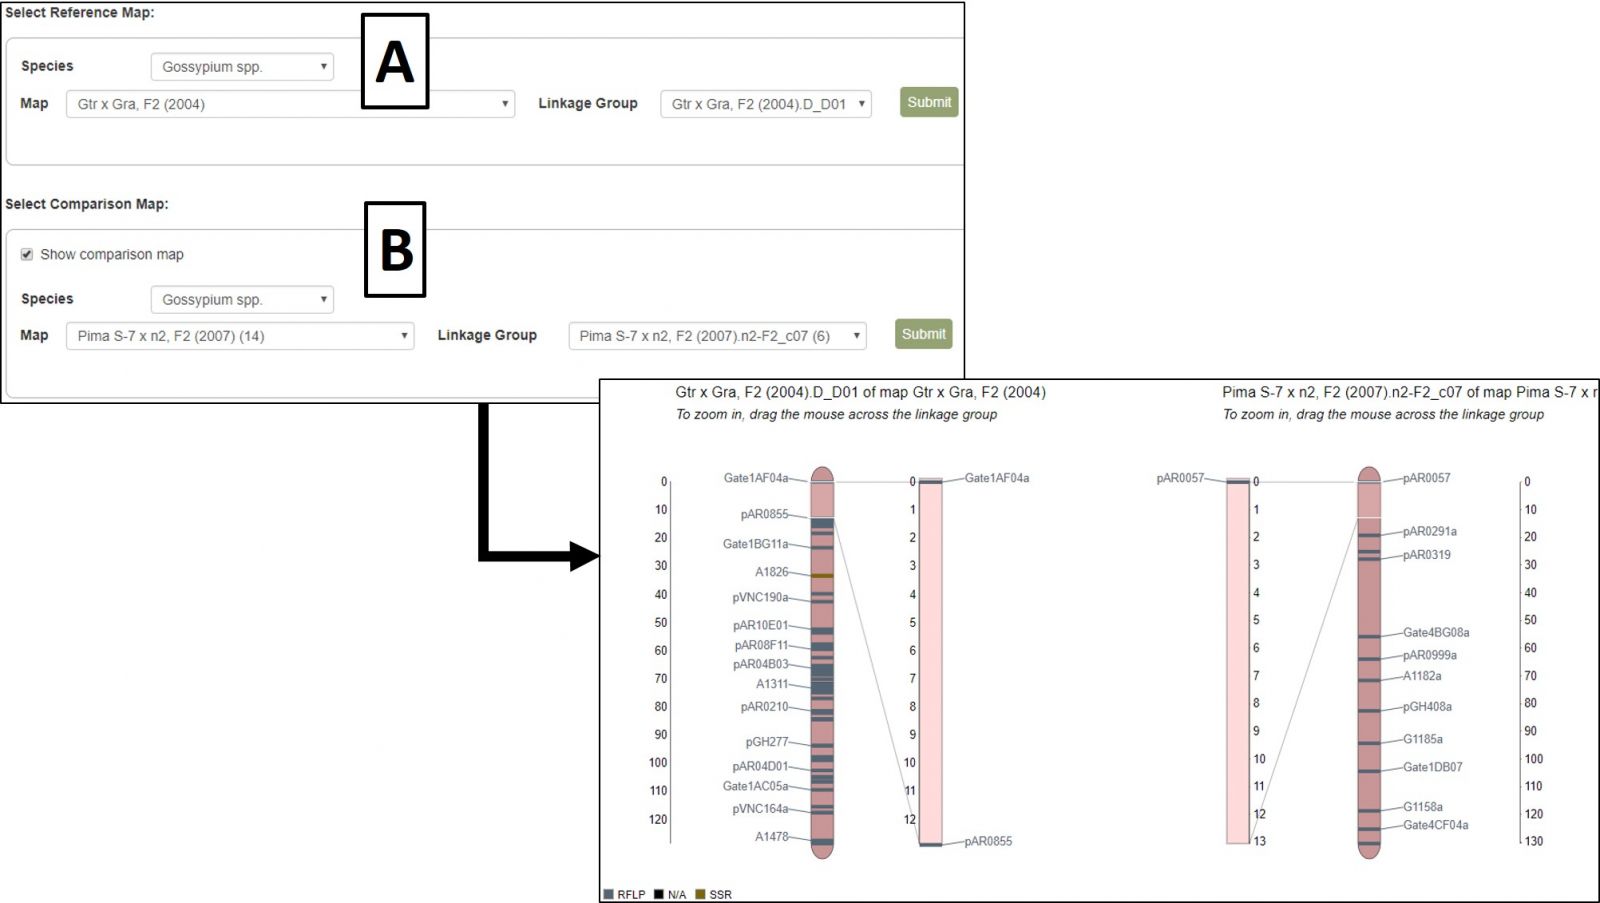
Figure 37. Changing map/linkage group and displaying comparison maps in MapViewer.
Synteny Viewer
Conserved syntenic regions among publicly available cotton genomes were analyzed by CottonGen and made available using the Tripal Synteny Viewer developed by the Fei Bioinformatics Lab from the Boyce Thomson Institute at Cornell University. Analysis was done using MCScanX (Wang et al. 2012) with default settings and blast files were made using blastp with an expectation value cutoff < 1e-10, maximum alignment of 5, and maximum scores of 5.
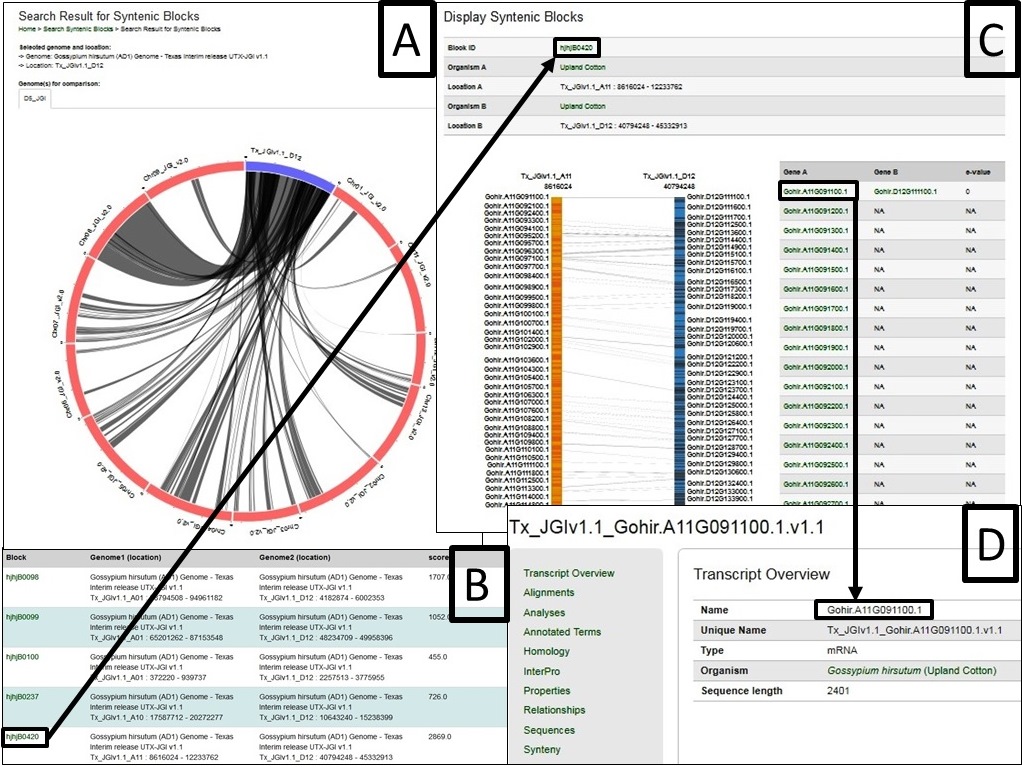
The synteny viewer displays all the conserved syntenic blocks between a selected chromosome of a genome and another genome in a circular and tabular layout. Once a block is chosen in the circular or tabular layout, all the genes in the block are shown in a graphic and tabular format. The gene names have hyperlinks to gene pages where detailed information of the gene can be accessed. The ‘synteny’ section of the gene page displays all the orthologs and the paralogs with link to the corresponding syntenic blocks or gene pages.
SyntenyViewer can be accessed from multiple locations including the Tools header menu (Fig. 38A) and in the Tools section (Fig. 38C) of Species Overview pages (Fig. 38B)
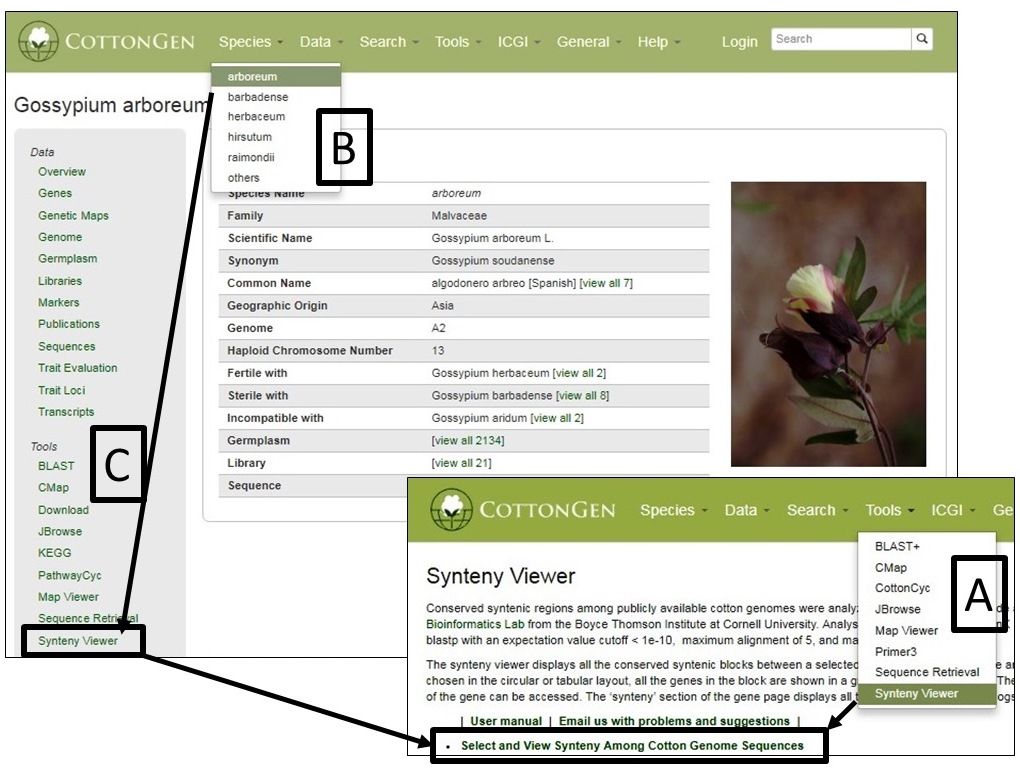
From the SyntenyViewer main page, clicking Select and View Synteny Among Cotton Genome Sequences will bring up Syntenic Blocks Search Page (Fig. 39). There are two ways to search and view Syntenic Blocks: One is searching by a genome (Fig. 39A) and a chromosome/scaffold of it (Fig. 39B), and (a) genome(s) for the comparison (Fig. 39C); The other way is to view a block by search its ID (Fig. 39D)
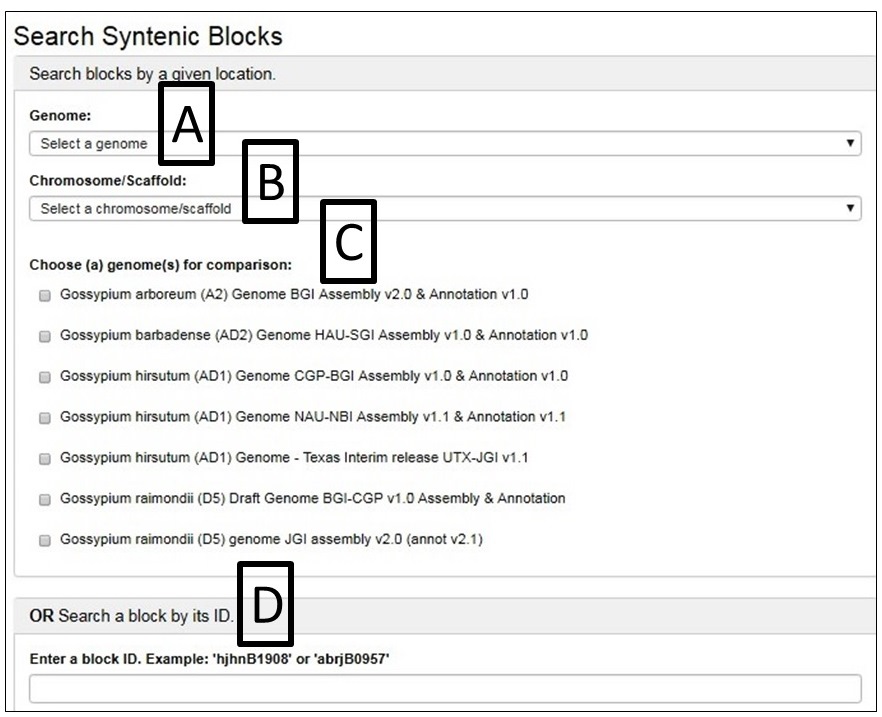
Fig. 40 gives an example as the chromosome Dt 12 of AD1-UTX-JGI genome is selected and compared by the D5-JGI genome. A. the the syntenic blocks in circle plot; B. Information table of pair-wised collinear blocks; C. Gene names involved in a specific block ID and display; D. Gene names are linked to CottonGen