User Manual
This manual describes how to access data and use the tools on the Genetic, Genomic, and Breeding Database for Cotton (CottonGen). Please use the sidebar on the left to navigate to different parts of the manual, or click on the section titles below. You can access the next page of the manual by clicking on the title of the next page below.
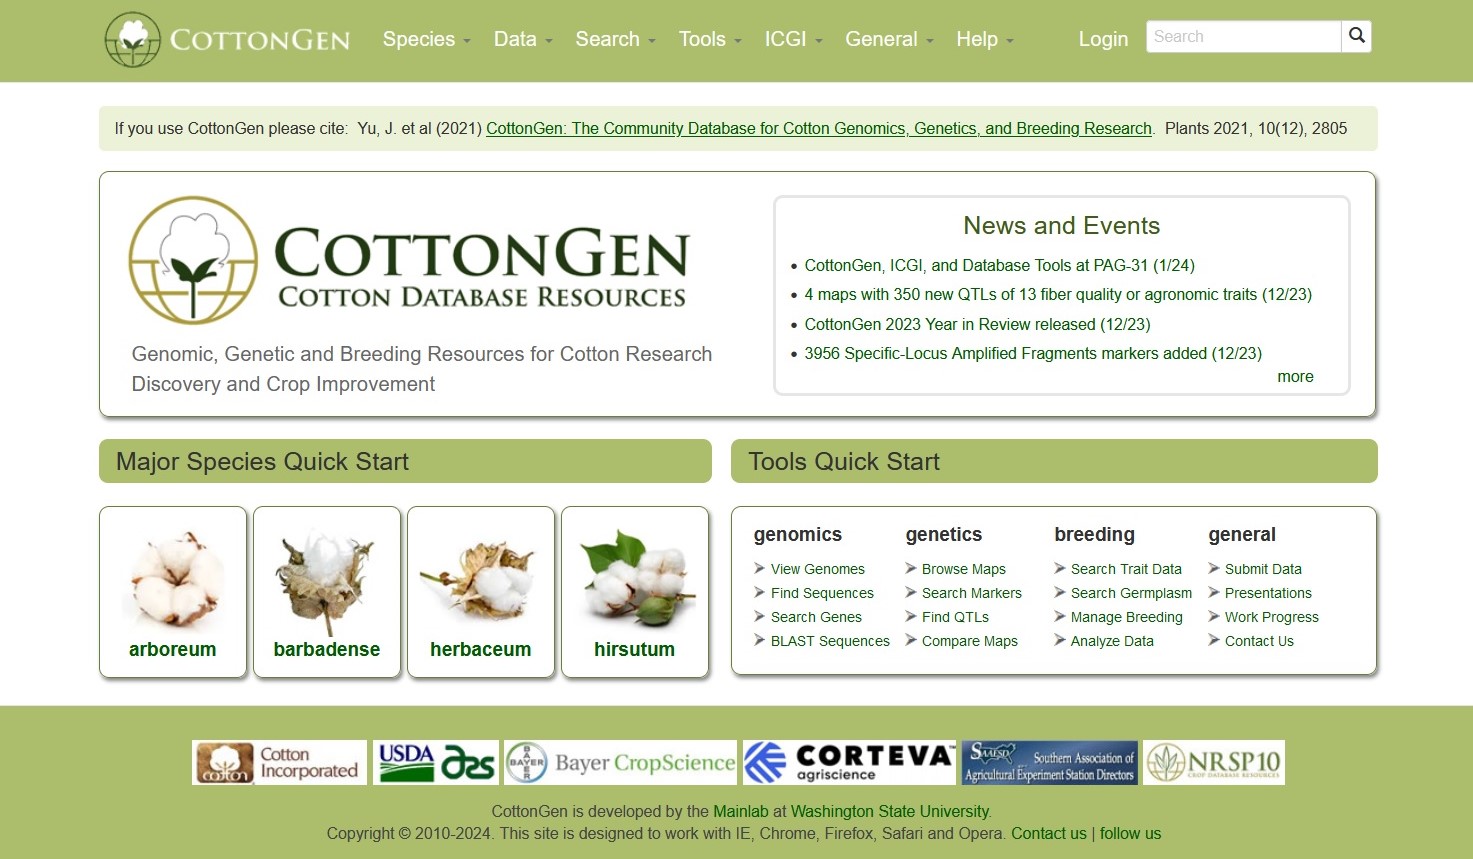
Homepage Overview
The CottonGen home page can be reached at www.cottongen.org
For quick access to data, visit the Species, Data or Search section in the navigation bar or click appropriate link from the Major Genera Quick Start or Tools Quick Start section.
Species Overview Page
Species pages can be accessed under the 'species' pull-down menu in the main navigation bar. Each species has an overview page for users easily access the data and tools for the species of interest.
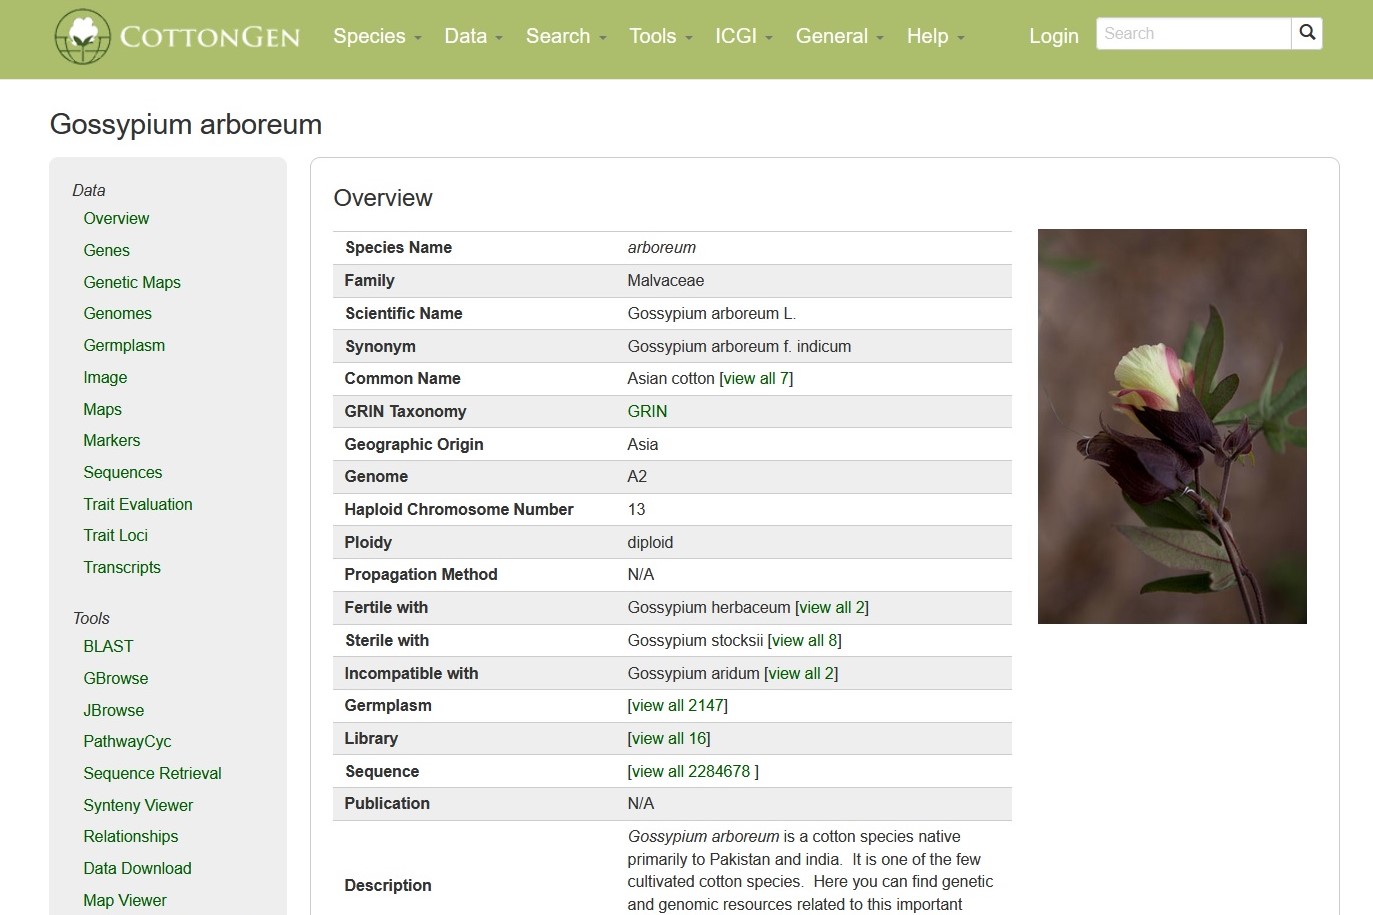
The species pages have a resources bar on the left panel so that users can quickly access data and tools for the species. Depending on the species, more or less items will be displayed on the resource bar. Below are some items in the resource bars.
1. Genome(s)
Where whole genome sequences are available, hyperlinks to each genome assembly page are shown on the resources bar.
2. Germplasm
The germplasm page provides a list of germplasm that are stored in CottonGen.
3. Sequences
Each species page has a hyperlink to the corresponding NCBI core nucleotide sequence page (downloaded from NCBI) for the species
4. Maps
Each species page has hyperlink to dynamically generated list of the genetic maps that are available in CottonGen.
5. Tools
The links subpage shows various useful links outside CottonGen for the species.
6. PathwaysCyc
Where PlantCyc databases are available for a species, hyperlinks to each PlantCyc page are shown on the resources bar. The predicted genes from the whole genome sequences were utilized in the construction of PlantCyc (metabolic pathway) databases using PathwayTools.
If you have any questions/comments/feedback about the species site, please let us know via the contact form.
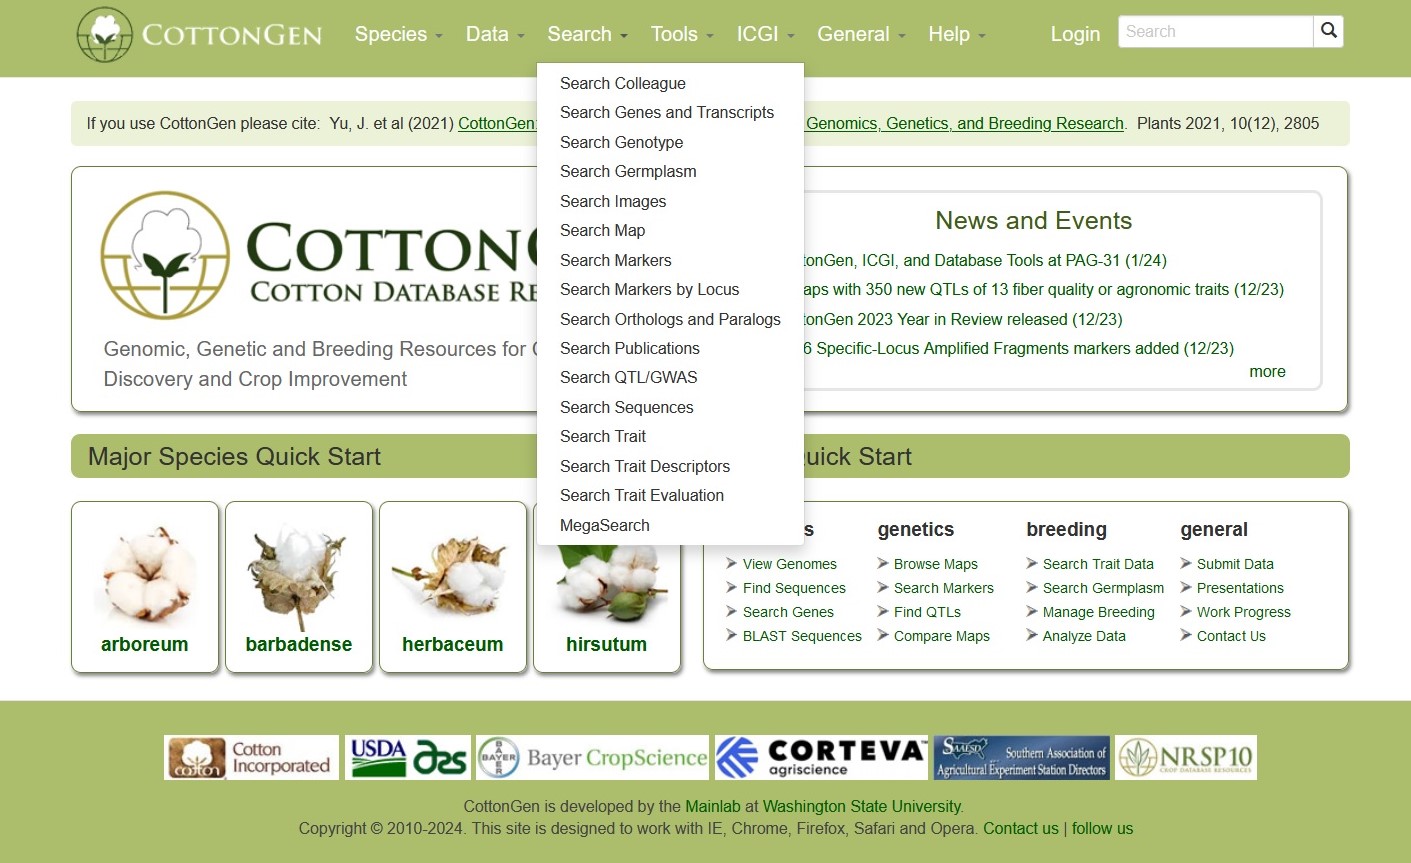
Data Searches
To access the different data searches, click on 'search' in the menu header and then select the data type you would like to search. To learn more about each search interface, please see the links below the figure.
Search Colleagues
Search Colleague can be accessed through the Search menu in the header. It is a page allows for browsing a list of registered CottonGen users for collaboration and assistance on Cottongen-related topics.
CottonGen Colleague Search Interface.
Search Genes and Transcripts
[ Video Tutorial: How to Search for Genes and Transcripts ]
Search Genes and Transcripts can be accessed through the Search menu in the header. It is a page where users can search for genes and transcripts.
from various datasets available in CottonGen. Users can search for genes from various datasets: predicted genes from whole genome assemblies, a single non-redundant list of cotton genes with gene symbols (Cotton Gene Database), or gene and mRNA sequences parsed out from the NCBI nucleotide database. These genes and mRNAs parsed out from the NCBI sequences are aligned to the reference whole genome sequences when possible. When expert-contributed information is available, these gene names are associated directly with the predicted genes from the whole genome assembly. Users can also search for transcripts from RefTrans sets or reference transcriptome sets built from all publicly available transcripts. For more details, refer to the 'Description of Gene and Transcript Dataset' page.
The search interface of Search Gene and Transcripts. The Query session is on the left and the Downloadable Fields is on the right. See detailed explanation at below.
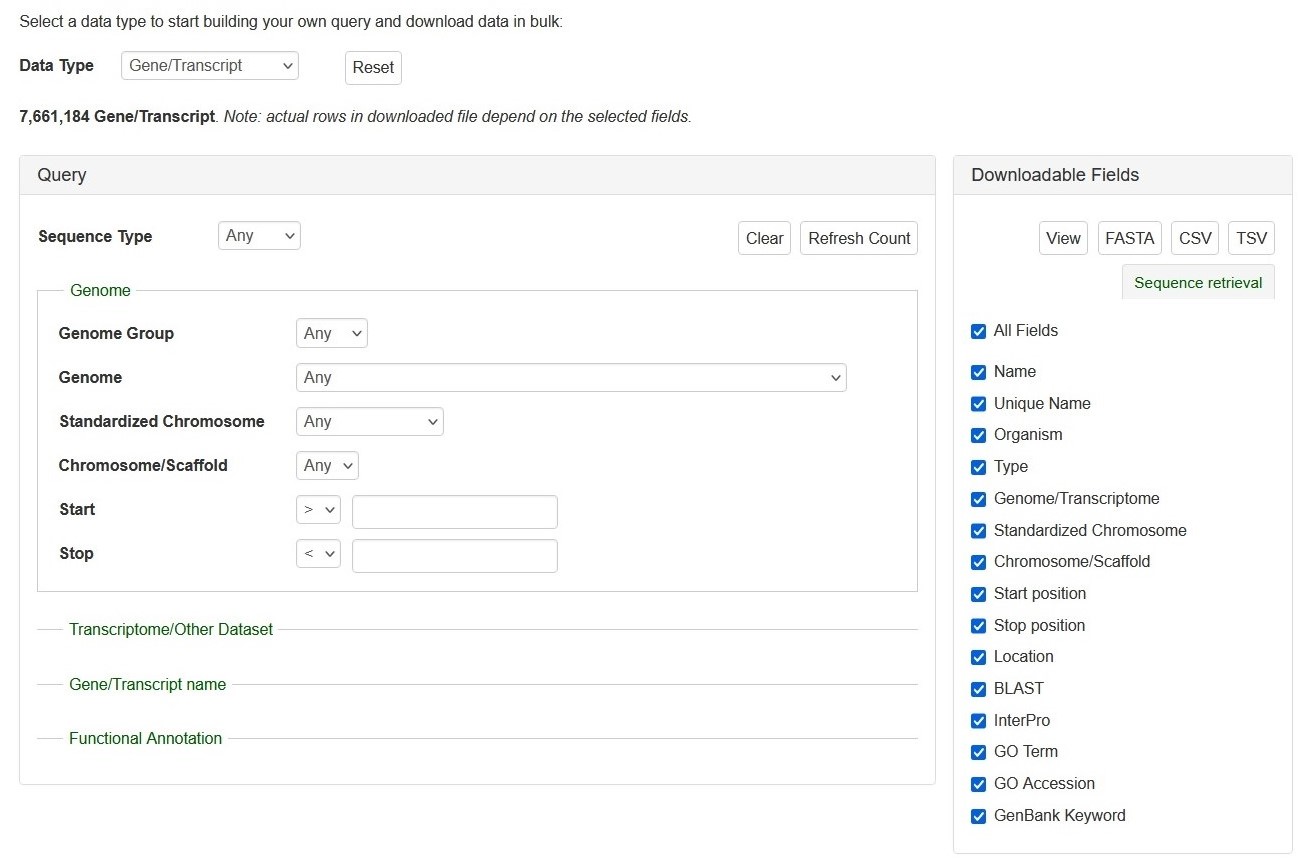
Search Genes and Transcripts can be limited to datasets by four categories (red arrows on left), such as genome and RefTrans assemblies or NCBI genes, by giving gene or transcript names, or by functional annotations. Here are the descriptions of how to search Gene/Transcript data:
There are left (Query) and right (downloadable fields) sessions in the search interface.
Query (Please Note: All the search categories below, except the file upload, can be combined.)
1. Genome
- Genome Group: Users can limit their results of predicted genes by genome groups (such as AD, A, D, etc).
- When a genome group is chosen in the drop-down menu next to 'Genome Group':
- The corresponding genomes are dynamically displayed in the 'Standardized Chromosome'
- The corresponding genomes are dynamically displayed in the 'Genome' and
- When a genome group is chosen in the drop-down menu next to 'Genome Group':
- Genome and Chromosome/Scaffold: Users can limit their results of predicted genes by their genome location.
- When a genome assembly is chosen in the drop-down menu next to 'Genome', the corresponding chromosome or scaffold names are dynamically displayed in the 'Chromosome/Scaffold'. Choose any option and then type in the position in bp in the text boxes.
- Standardized Chromosome: The standardized chromosome names (given by CottoGen) for each genome group.
- When a genome group name is chosen in the drop-down list next to 'Genome Group' and choose an option from the 'Standardized Chromosome' list:
- The search result contains genes or transcripts on the same standard chromosome from all genomes in the genome group.
- When a genome group name is chosen in the drop-down list next to 'Genome Group' and choose an option from the 'Standardized Chromosome' list:
- Start and Stop: Users can limit their results of predicted genes by their genome location.
- When a genome assembly is chosen in the drop-down menu next to 'Dataset', the corresponding chromosome or scaffold names are dynamically displayed in the 'Genome Location' drop-down menu. Choose any option and then type in the position in bp in the text boxes.
2. Transcriptome/Other Dataset: Use this drop-down menu to limit the results to sequences from a specific dataset.
3. Gene/Transcript Name: Users can search genes and transcripts by name for an exact match, that contains, starts with, or ends with the input, by selecting the desired option from the drop-down menu. The search is case-insensitive.
4. Functional Annotation: Users can limit their results by associated functional terms. Predicted genes from whole genome assembly and transcripts have been annotated with some of the following: homology to genes of closely related or plant model species, InterPro protein domains, GO terms, KEGG pathway, and ortholog terms. Users can enter any protein name (eg. polygalacturonase), KEGG term/EC number (eg. resistance, EC:1.4.1.3), GO term (eg. cell cycle, ATP binding), or InterPro term (eg. zinc finger) in the text box to limit the results with the entries that are associated with the functional annotation terms.
Downloadable Fields
1. View|FASTA|CSV|TSV: Users can 'View' the query results on the web interface or download the results in the format of 'FASTA' (of the gene/transcript sequences) or CSV (Comma Separated Values) or TSV (Tab-Separated Values).
2. The All Fields List: A list of fields that users can decide whether in the search results to view or download.
If you have any questions/comments/feedback about this search page, please let us know via the contact form.
Search Genotypes
Search SNP Genotype can be accessed through the Search menu in the header. It is a page with SNP as the default tab followed by the SSR tab. Users can search SNP genotype data by dataset name, marker name, germplasm name, and/or species.
Below is the web interface of Search SNP Genotype with examples of selected Dataset, Species, Germplasm Name, and part of the search results.
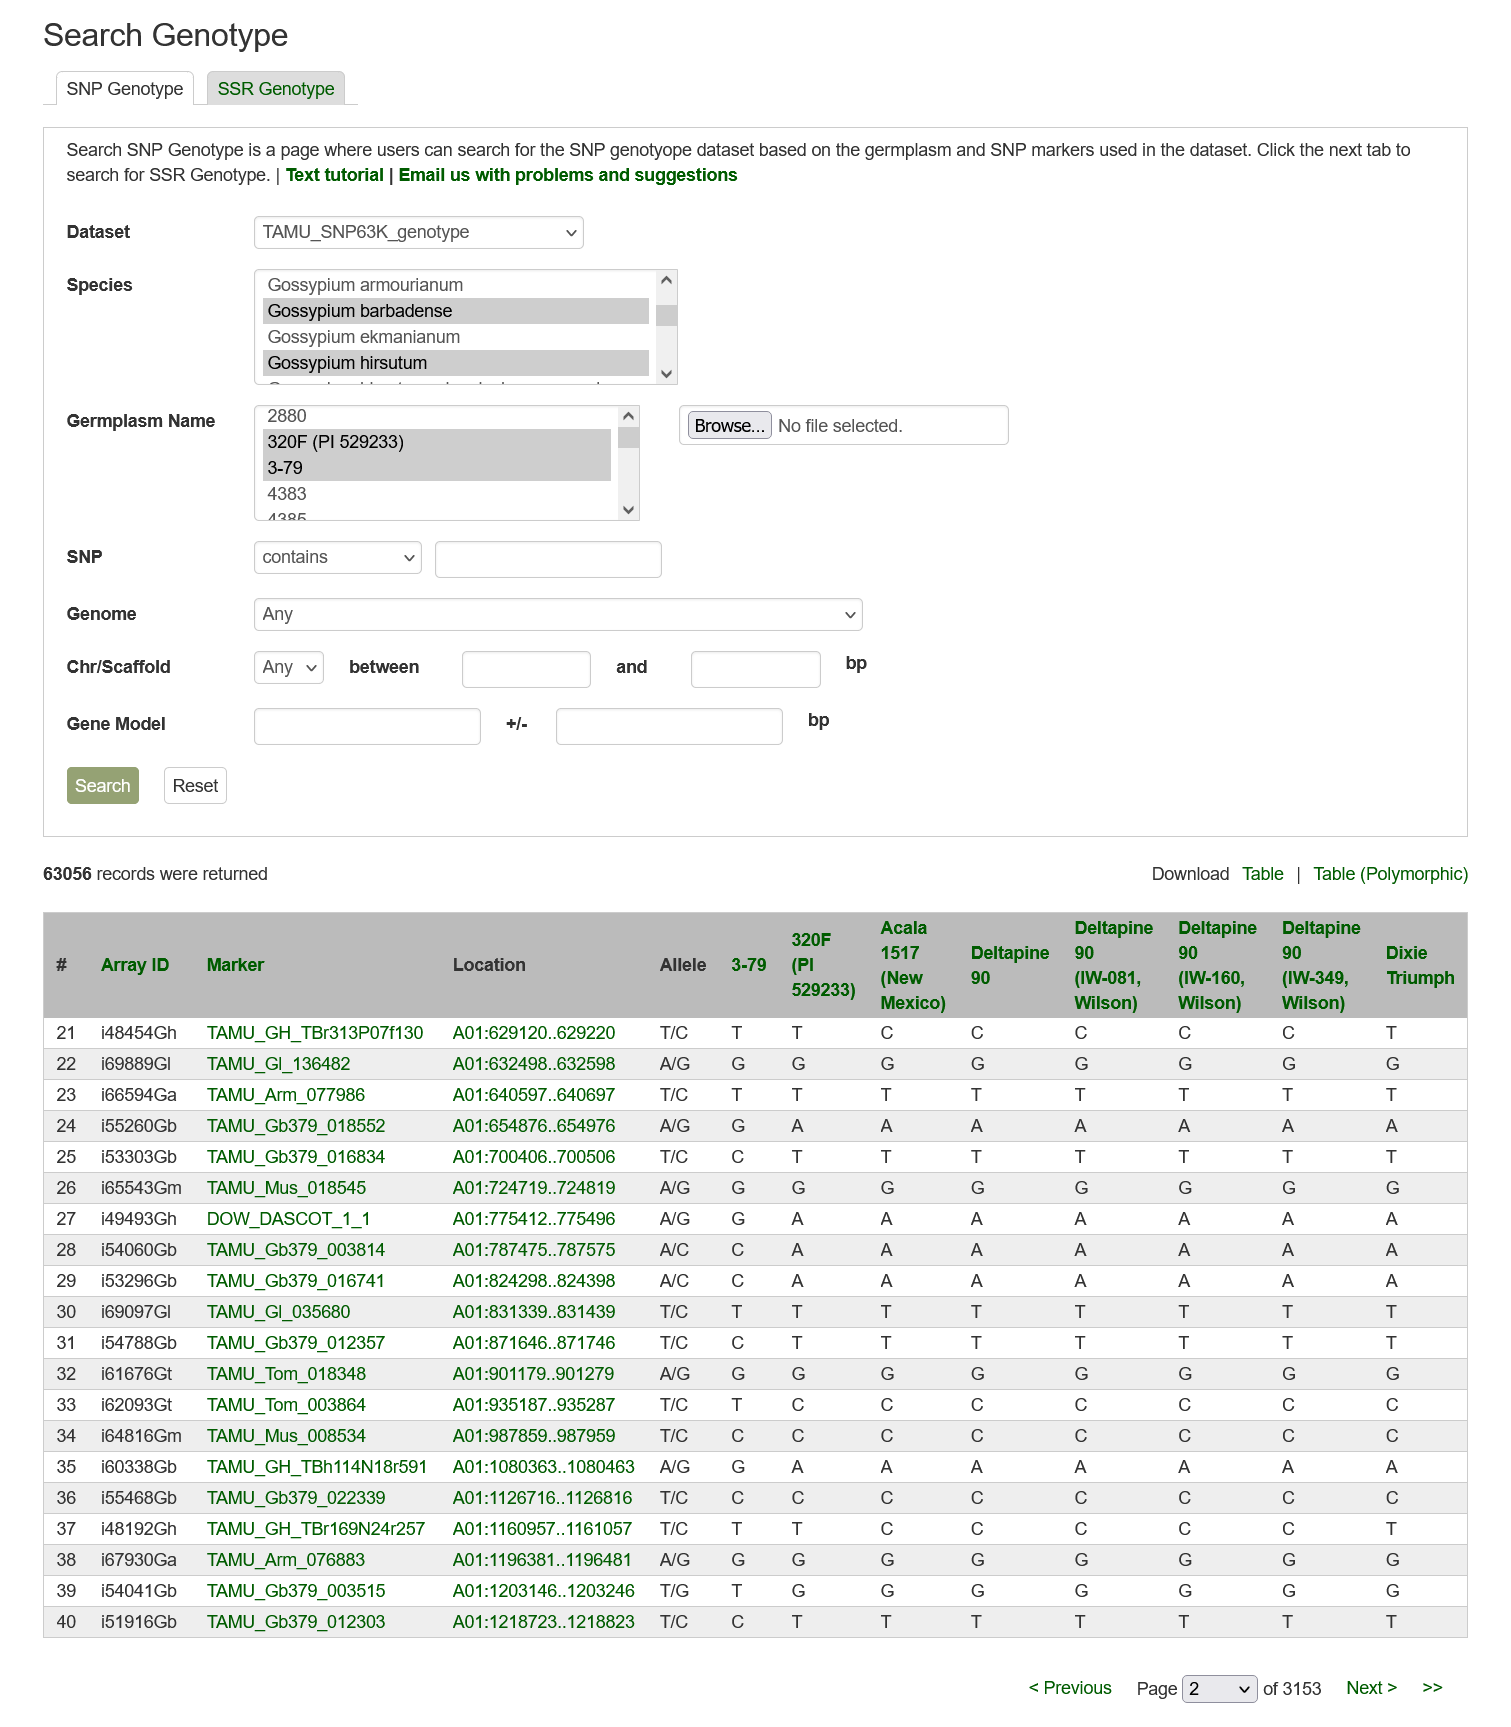
Please Note: All the search categories below can be combined and setting multiple filters will only return results matching all criteria.
1. Dataset: Users can search SNP genotype data by dataset from a dropdown list.
2. Species: Users can search for the SNP genotype dataset from a specific species by choosing from the drop-down menu. Multiple options can be selected by holding down the "Ctrl" key.
3. Germplasm Name: Users can search for an SNP genotype dataset from a specific germplasm by choosing from the drop-down menu. Multiple options can be selected by holding down the "Ctrl" key.
4. SNP: Users can search for an SNP genotype dataset that uses a specific marker by typing the marker name in the text box. Users can search for an exact match, that contains, starts with, or ends with the input, by selecting the desired option from the drop-down menu.
5. Genome: Users can search SNP genotype data by the anchored position of SNPs in one of the whole genome sequences. Choose a genome in the drop-down menu next to 'Genome' then the corresponding chromosome or scaffold names will be dynamically generated in the 'Chr/Scaffold' drop-down menu. Choose any option and then type in the position in bp in the text boxes.
6. Search Result: Results are returned in a table that can be downloaded from the entire table or the table with polymorphism data only.
Click on the SSR tab to start an SSR Genotype search.
--- will be completed soon
If you have any questions/comments/feedback about this search page, please let us know via the contact form.
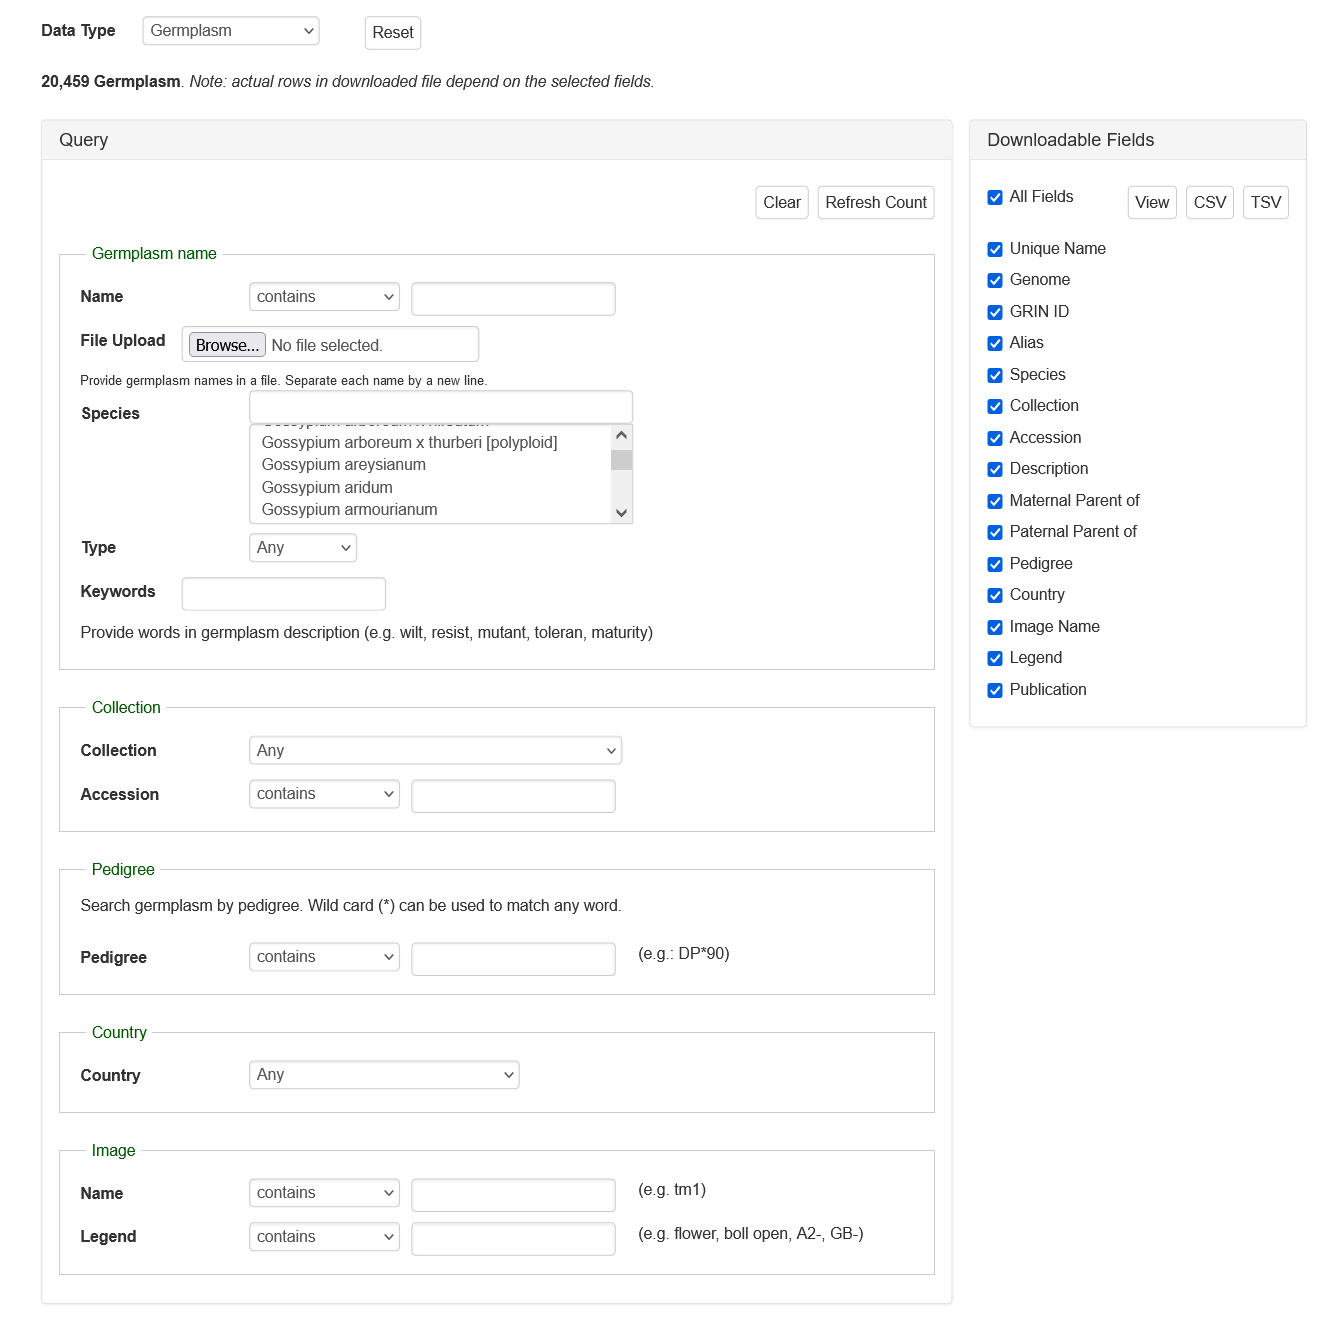
Search Germplasm
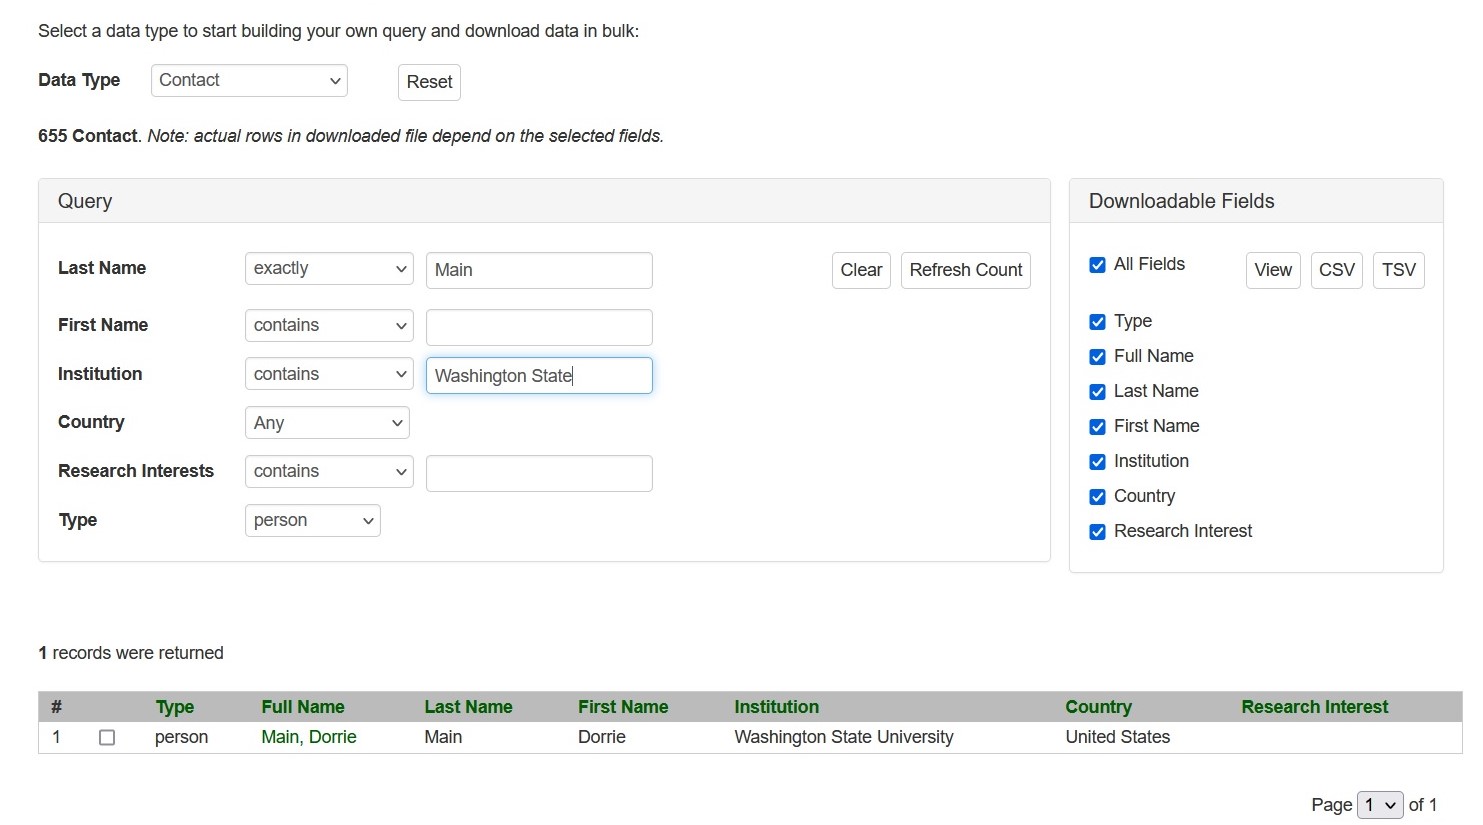
The Germplasm Search can be accessed through the Search menu in the header. Information about germplasms linked to data in CottonGen can be searched by name, species, type, collection, pedigree, country of origin, or image. A list of germplasm names, in a text file, can also be uploaded to search for multiple germplasms at once.
If you have any questions/comments/feedback about this search page, please let us know via the contact form.
Publications
Search Publications can be accessed through the Search menu in the header. It is a page where users can search for publications using a combination of keywords (in the abstract or title), all or partial titles, authors, and other categories. Search results link to the publication detail pages that contain the abstract, citation, external link to the full article, and other details. The CottonGen houses information about publications on cotton genomics, genetics, and breeding research. Details about publications were imported to the CottonGen from NCBI PubMed and the USDA National Agricultural Library using the query: (abstract: trait OR QTL OR gene OR genome OR map OR microsatellite OR annotation OR EST OR marker OR sequence) AND (abstract: cotton). Additionally, details of publications from other journals not present in these databases are added.
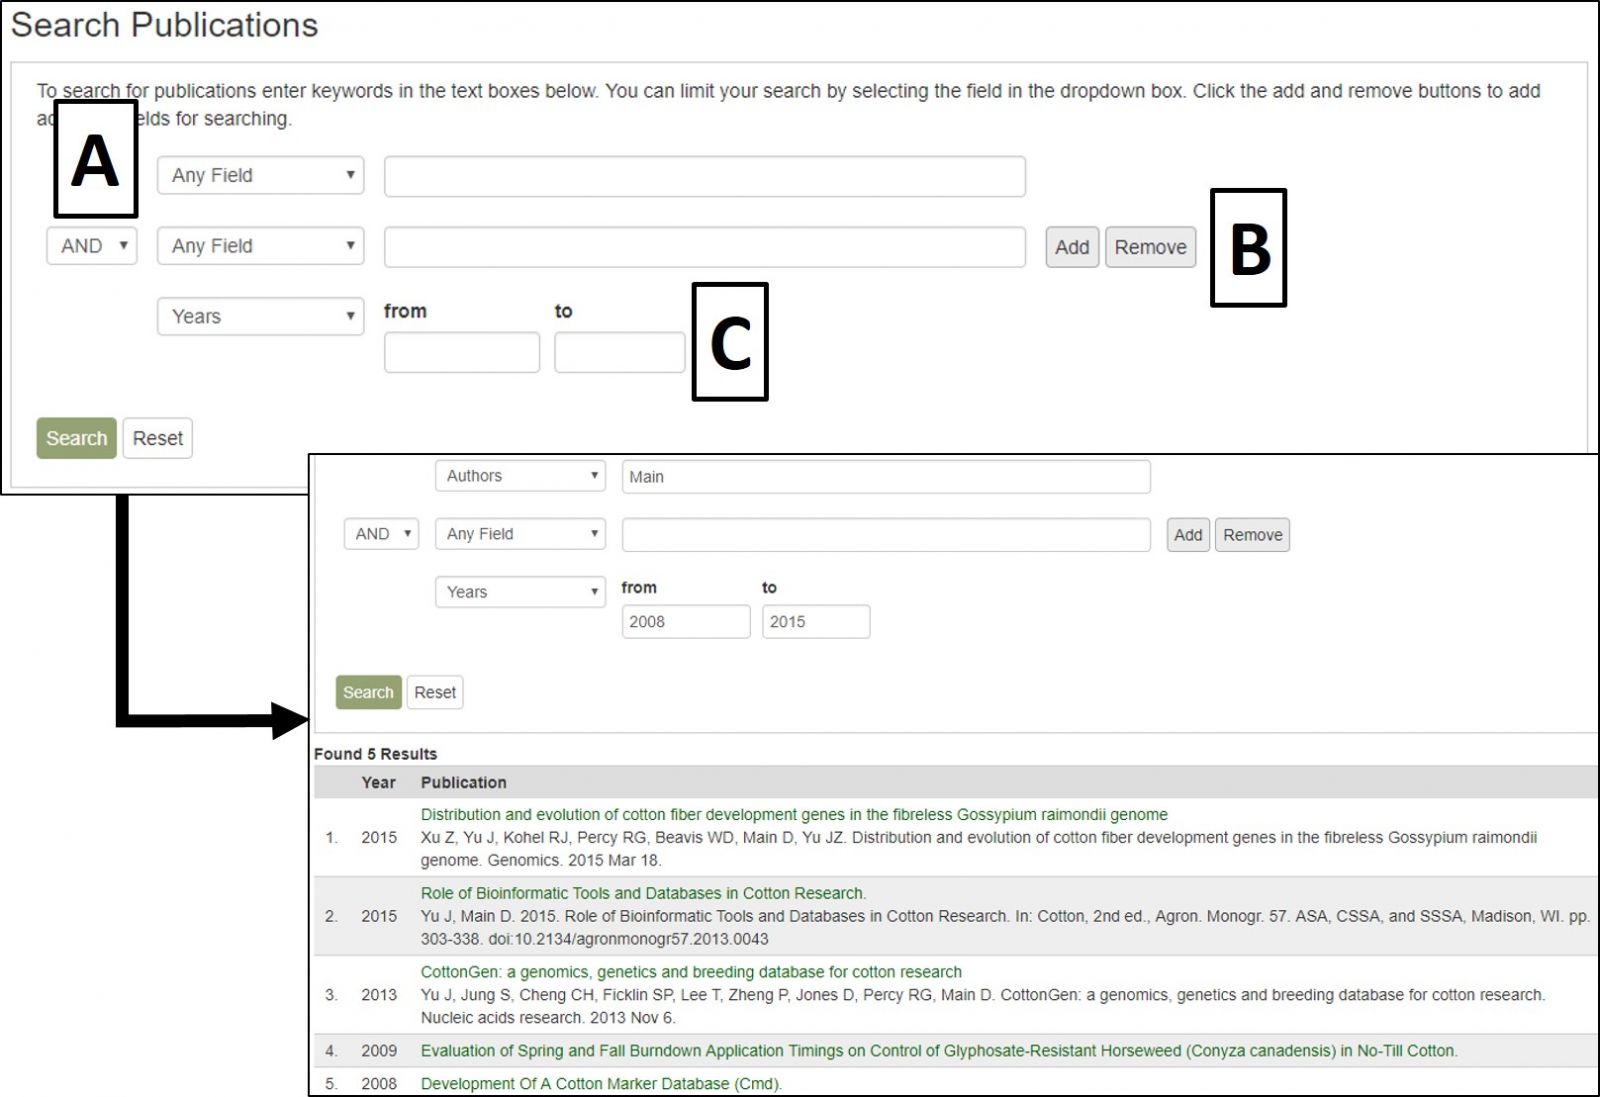
CottonGen Publication Search interface.
The search results table has information about each publication (Fig. 20A). By clicking the publication title, more detailed information is displayed. Most publications also have a link to the publisher website or PubMed record in their titles (Fig. 20B).
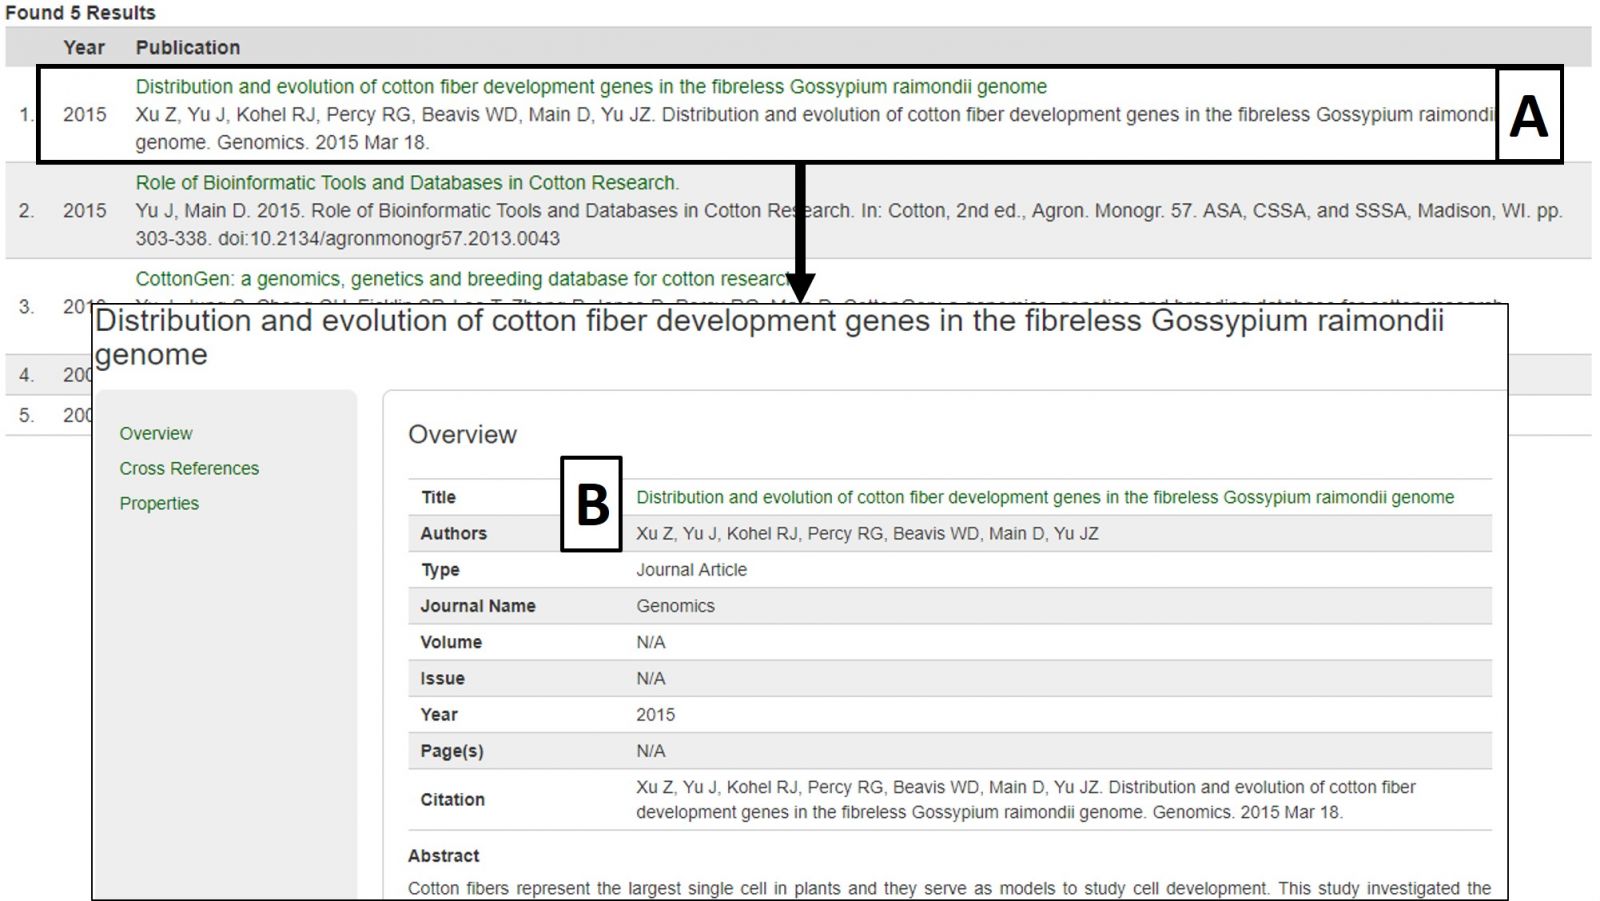
Figure 20. Publication search results and detailed publication information.
Search Markers
To search the markers in CottonGen, click on the Search menu in the header and select Search Markers. The Marker Search is useful for retrieving information about markers and can be broad or very specific depending on the parameters used. Markers can be searched individually by name or in groups by uploading a text file with multiple marker names. Filters can be set for marker type, cotton genome group, original marker species, and location (Fig. 17A). Alternatively, searches may be performed on only those markers that are mapped or are near a specific locus or QTL. Markers may also be browsed by associated genetic maps, chromosome positions, or genome groups (Fig. 17B).
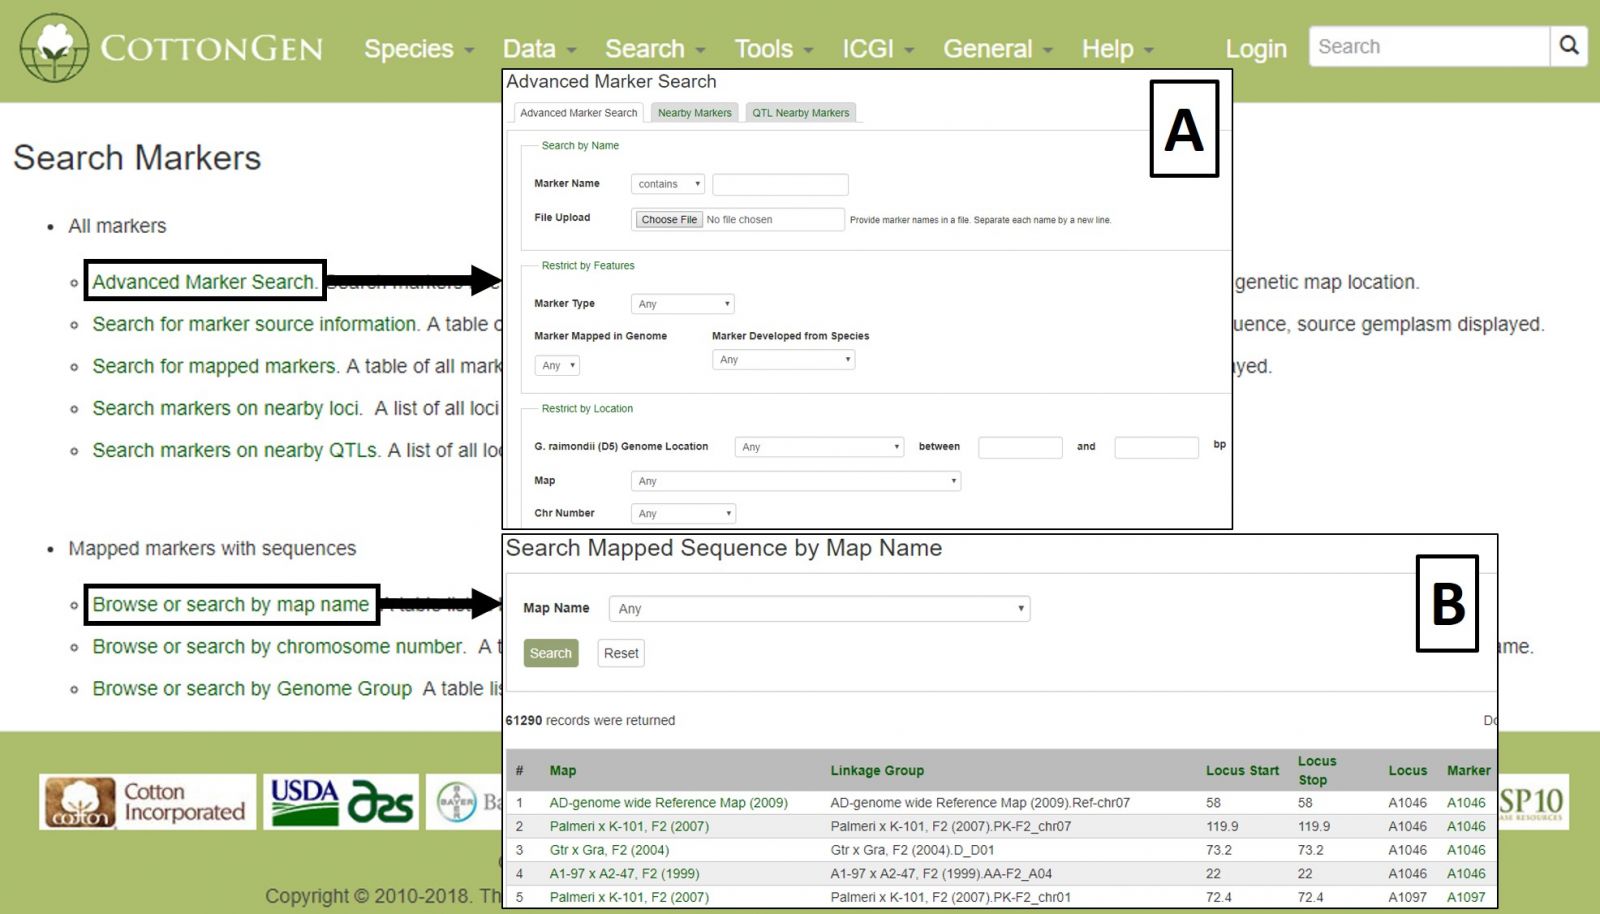
Figure 17. CottonGen Marker Search interface.
Search results are returned in table format, which is downloadable, as are associated sequences in Fasta format (Fig 18A). Clicking on a marker name displays the marker's page with information such as alignments and map positions (Fig. 18B). If you would like to change the search, either edit the parameters or click the reset button.
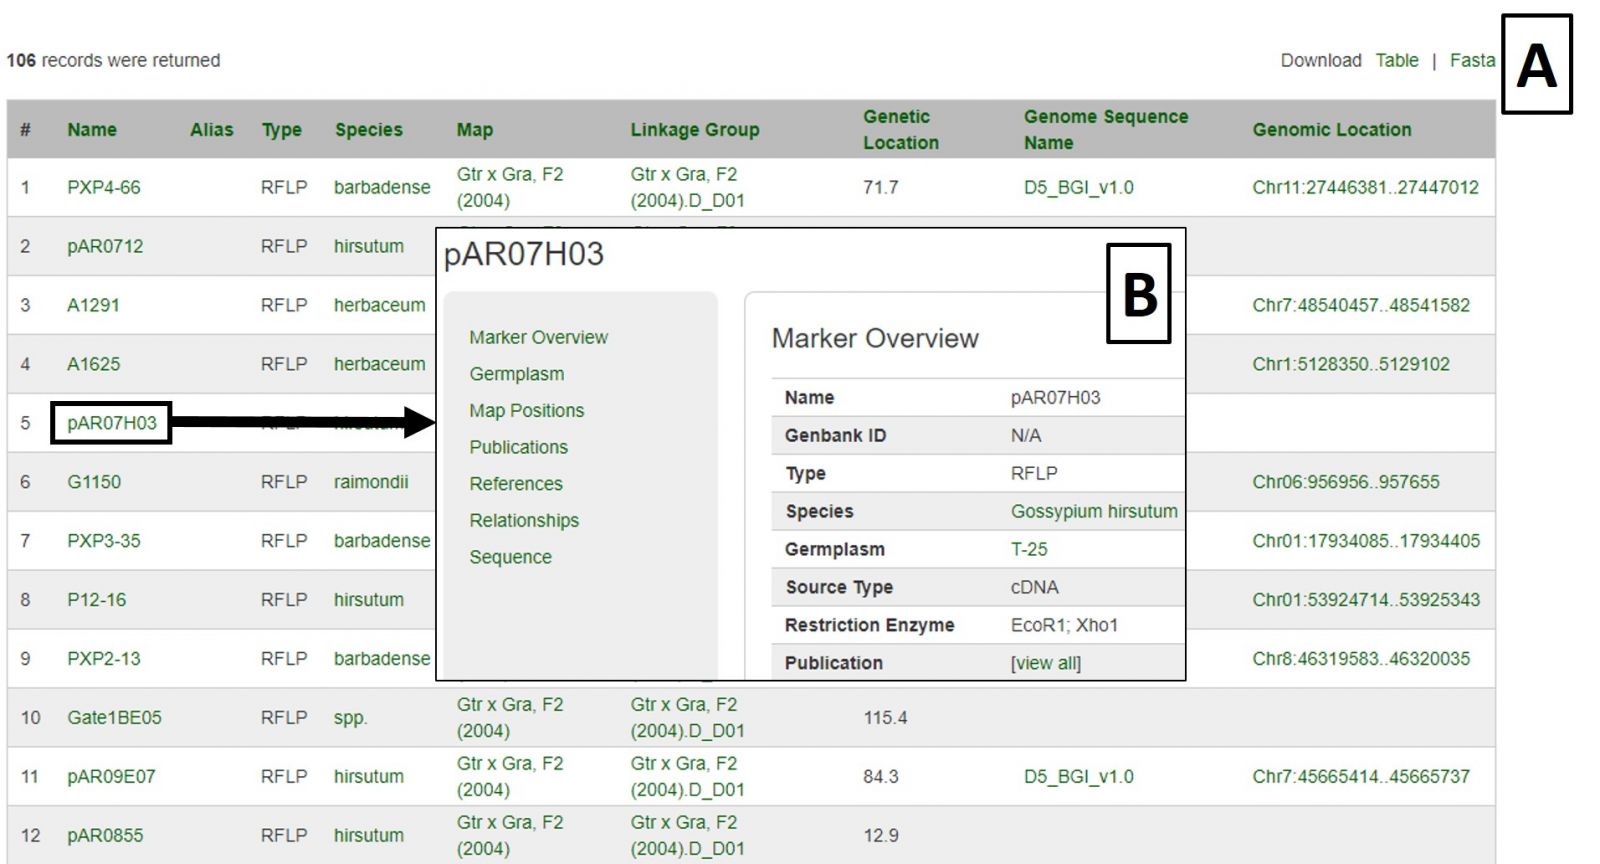
Figure 18. Marker Search results.
QTLs
Quantitative trait loci (QTLs) that are entered in CottonGen are searchable from the QTL Search option under the Search menu in the header. QTLs may be searched using trait keywords, published symbols (see the Cotton Trait Ontology list in the Data header menu), or unique identifiers assigned by CottonGen.
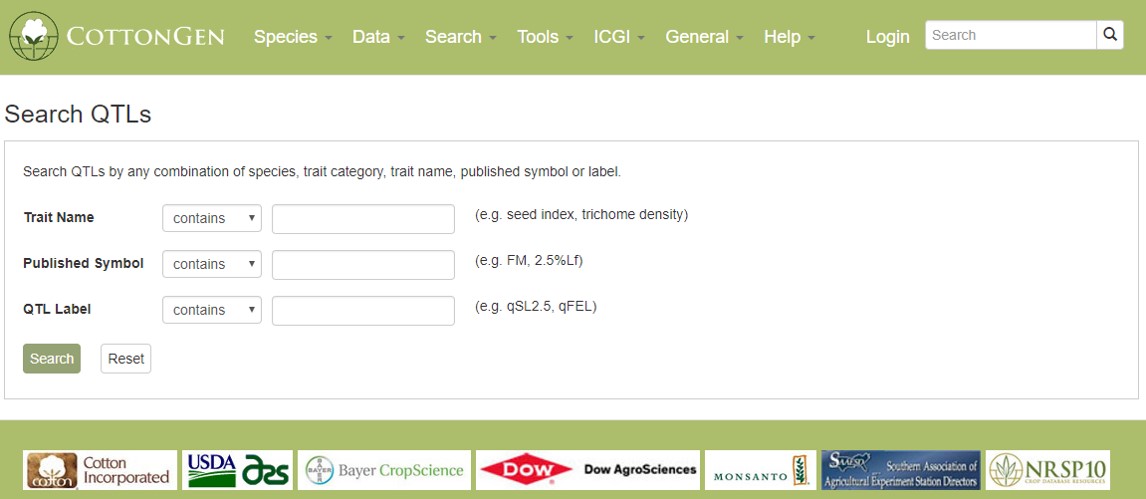
Figure 21. CottonGen QTL Search interface.
The results are returned in a downloadable table (Fig. 22A) with hyperlinks to more information about the QTL, the map it is located on, and the associated trait name and symbol. Clicking on the QTL label opens the overview page which has a link to map positions (Fig. 22B). From the map position table, the QTL can be viewed in MapViewer or CMap.
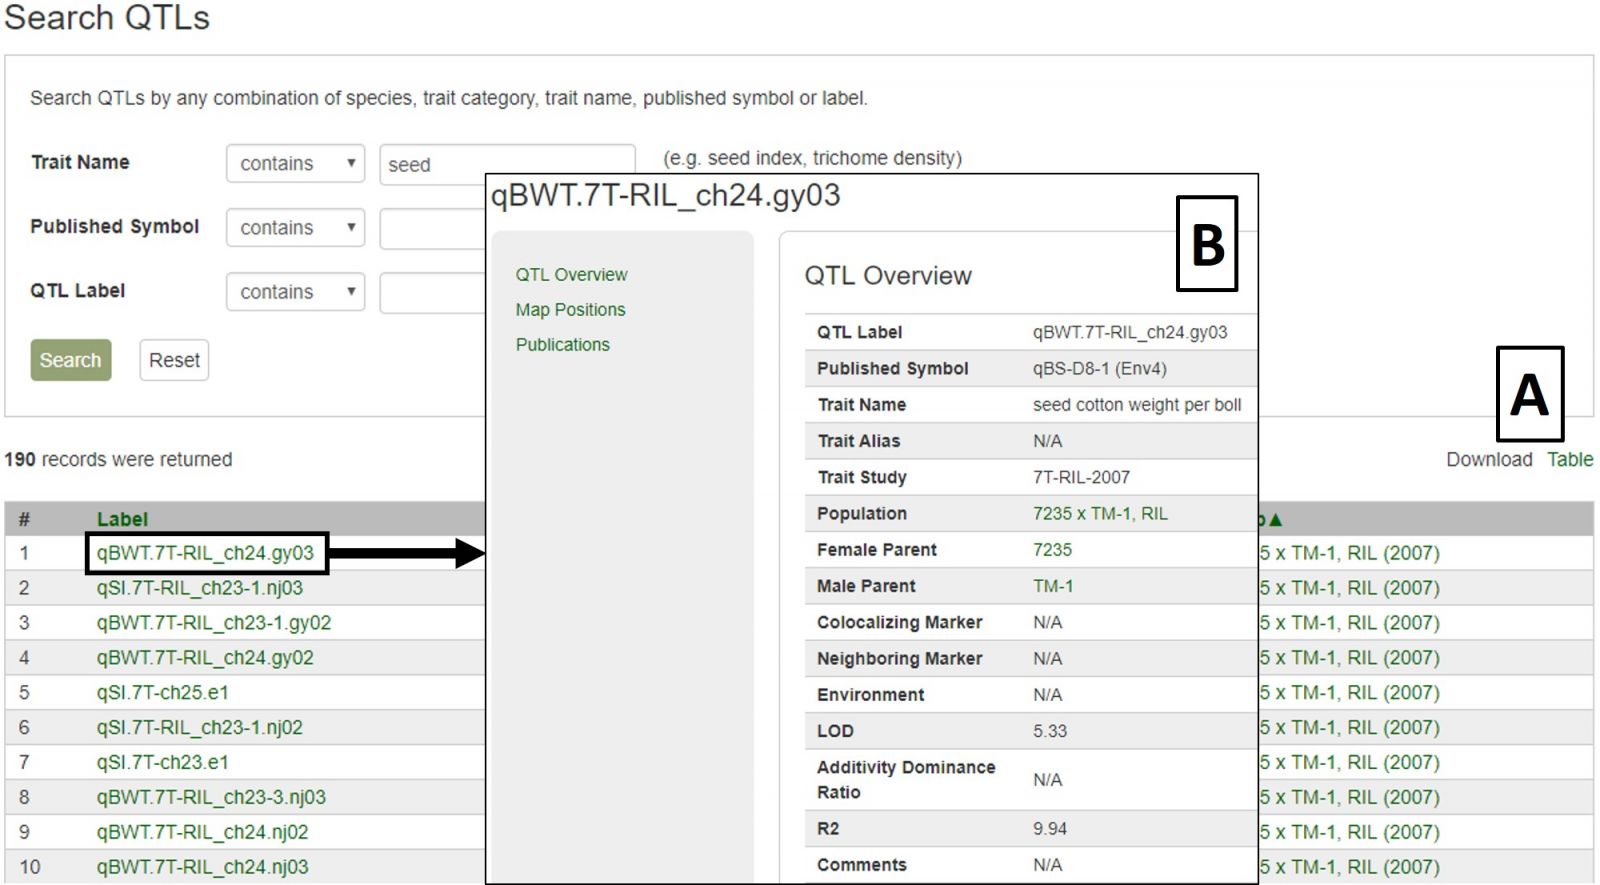
Figure 22. CottonGen QTL Search results.
Sequences
To search sequences, select Sequence Search from the Search header menu. This is useful for retrieving information about certain sequences from a larger dataset, or all the sequences from one or more datasets. The Gene and Transcript Search is limited to genes and transcripts, whereas the Sequence Search includes other sequence types. Use fewer filters to obtain broader results and more filters to narrow your results, as setting multiple filters will only return results matching all criteria. This is not a BLAST search; that is available under the Tools menu.
Sequence searches can be limited by species and sequence type (Fig. 23A). The search can also be restricted to a certain genome dataset and further by chromosome or scaffold location (Fig. 23B). The sequences in CottonGen can also be searched individually by name or in groups by uploading a text file with multiple names (Fig. 23C).
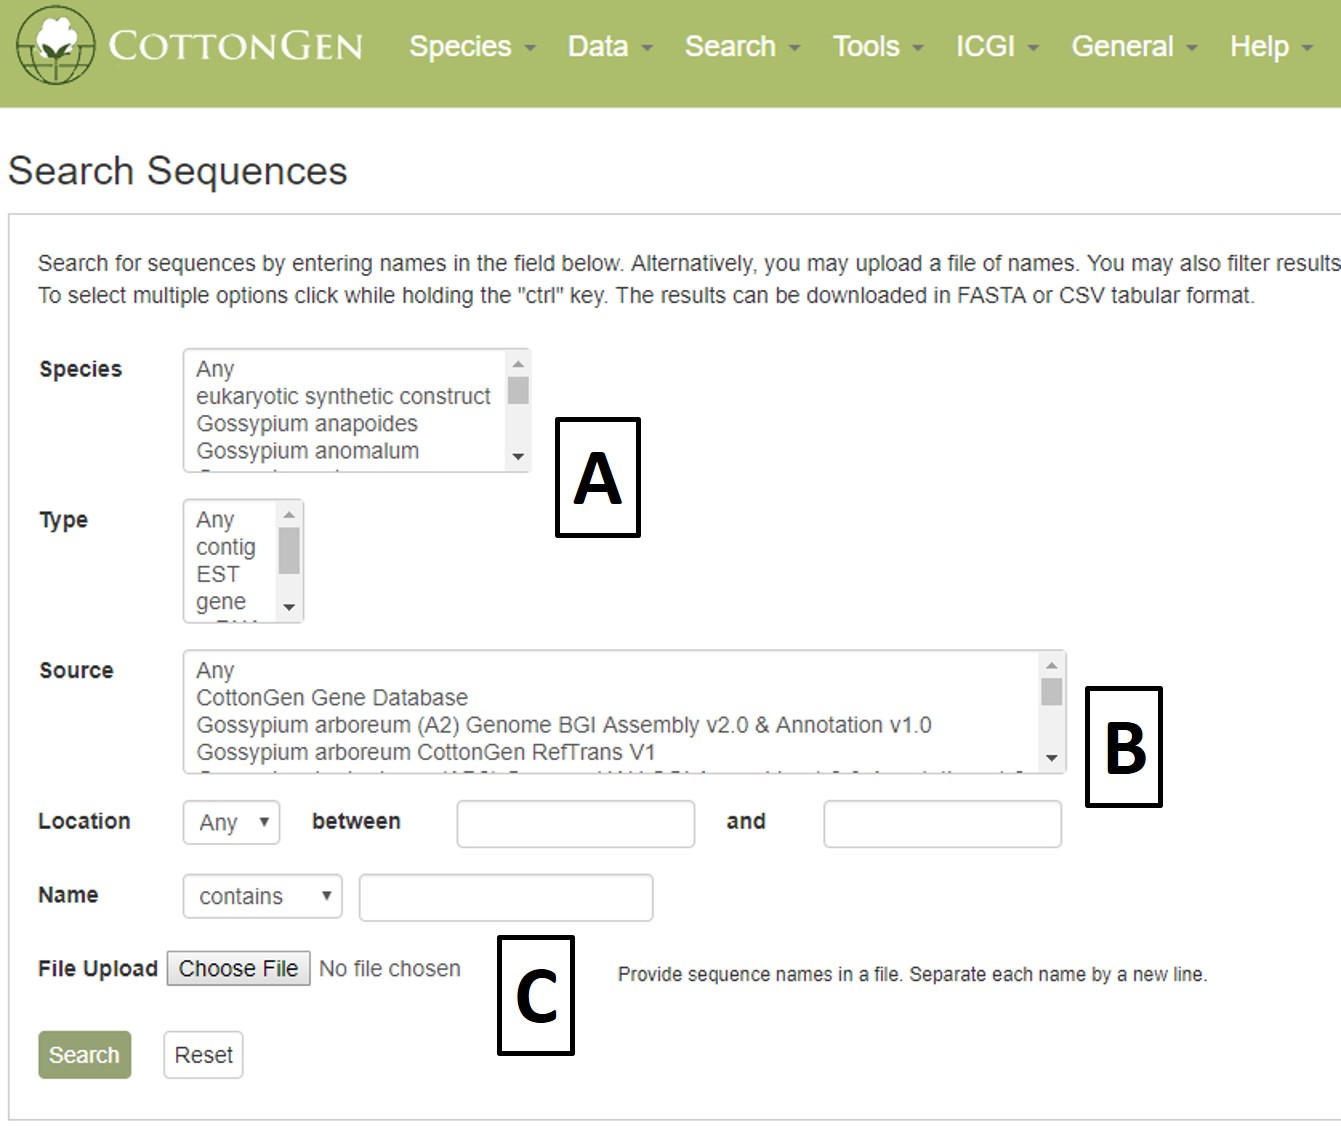
Figure 23. CottonGen Sequence Search interface.
Search results are returned in a table with hyperlinks to more information (Fig. 24A). The table can be downloaded, as well as a Fasta file of those sequences (Fig. 24B). A new search may be performed by changing the filters or using the Reset button.
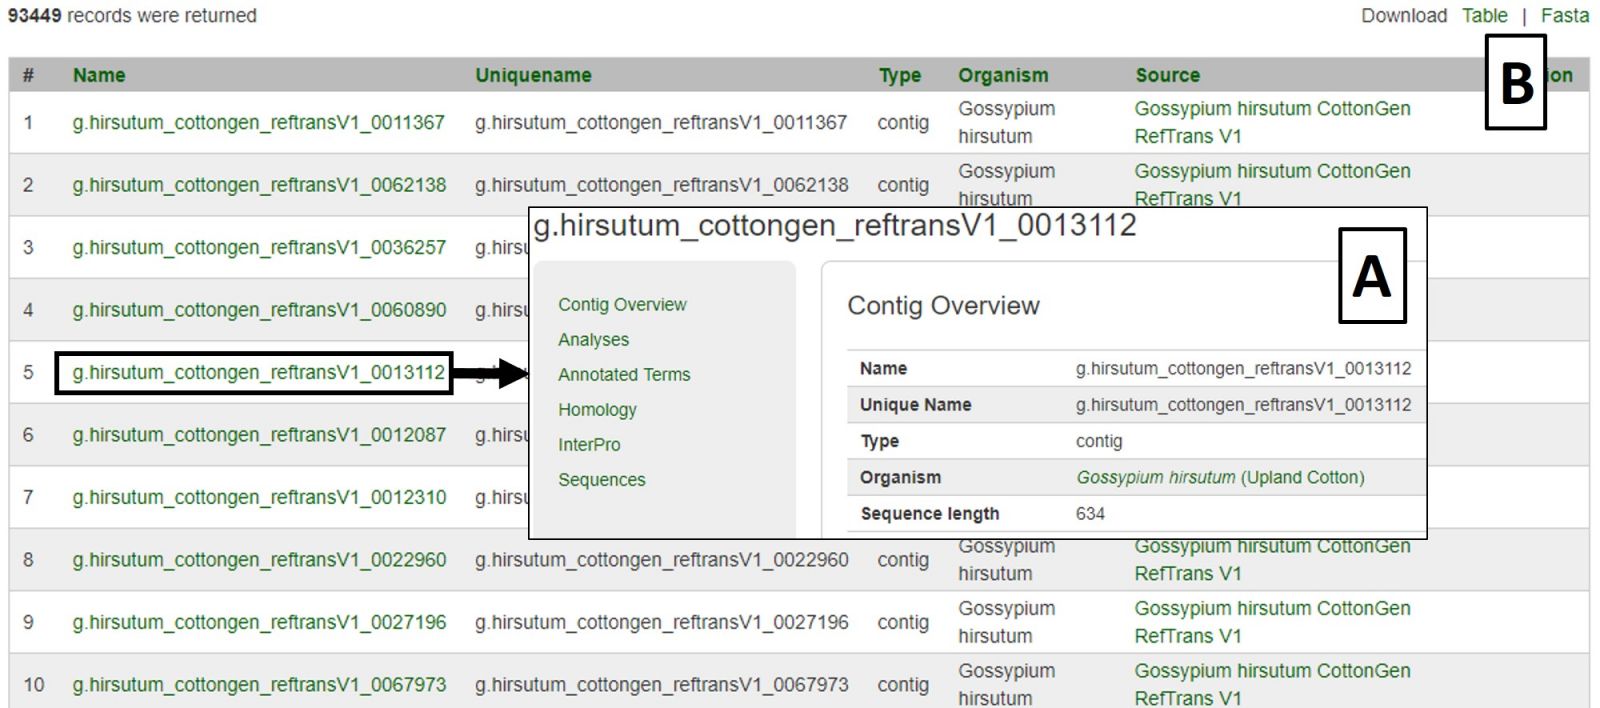
Figure 24. CottonGen Sequence Search results.
Trait Evaluations
The Trait Evaluation Search can be accessed through the Search menu in the header. This search retrieves phenotypic results from germplasm evaluation studies and is divided into Quantitative Traits (Fig. 25A) and Qualitative Traits (Fig. 25B). Quantitative Traits are those that can be measured using numerical values. Qualitative Traits are those that require the use of descriptors to evaluate.
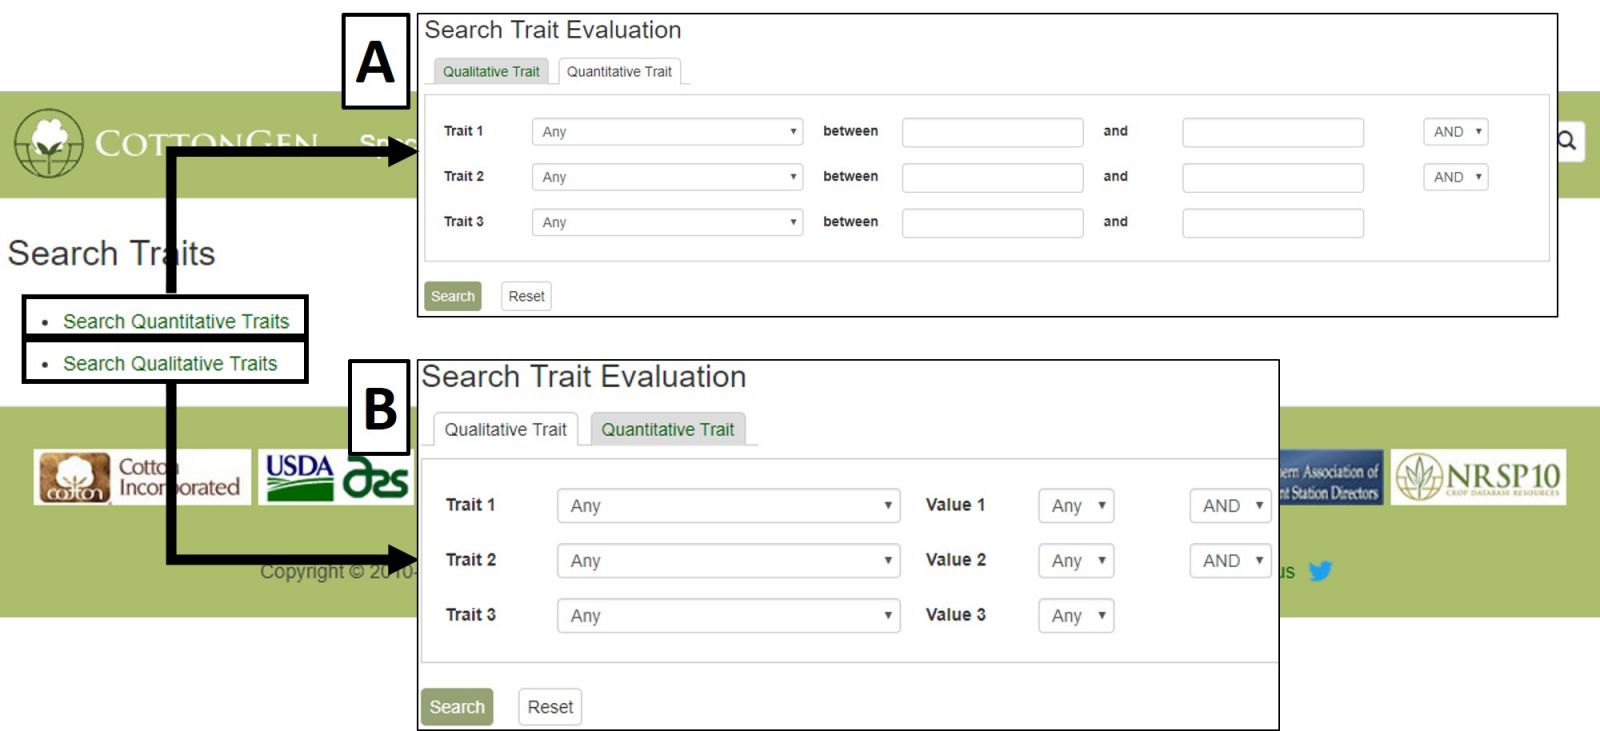
Figure 25. CottonGen Trait Evaluation Search interface.
Quantitative Traits are searched by choosing the desired trait or traits from the pull-down menus (Fig. 26A). This will autofill the value ranges based on the minimum and maximum trait values in CottonGen and can be restricted to narrow the search (Fig. 26B). Results are displayed in a downloadable table (Fig. 26C) with links to further information on evaluated germplasms (Fig. 26D).
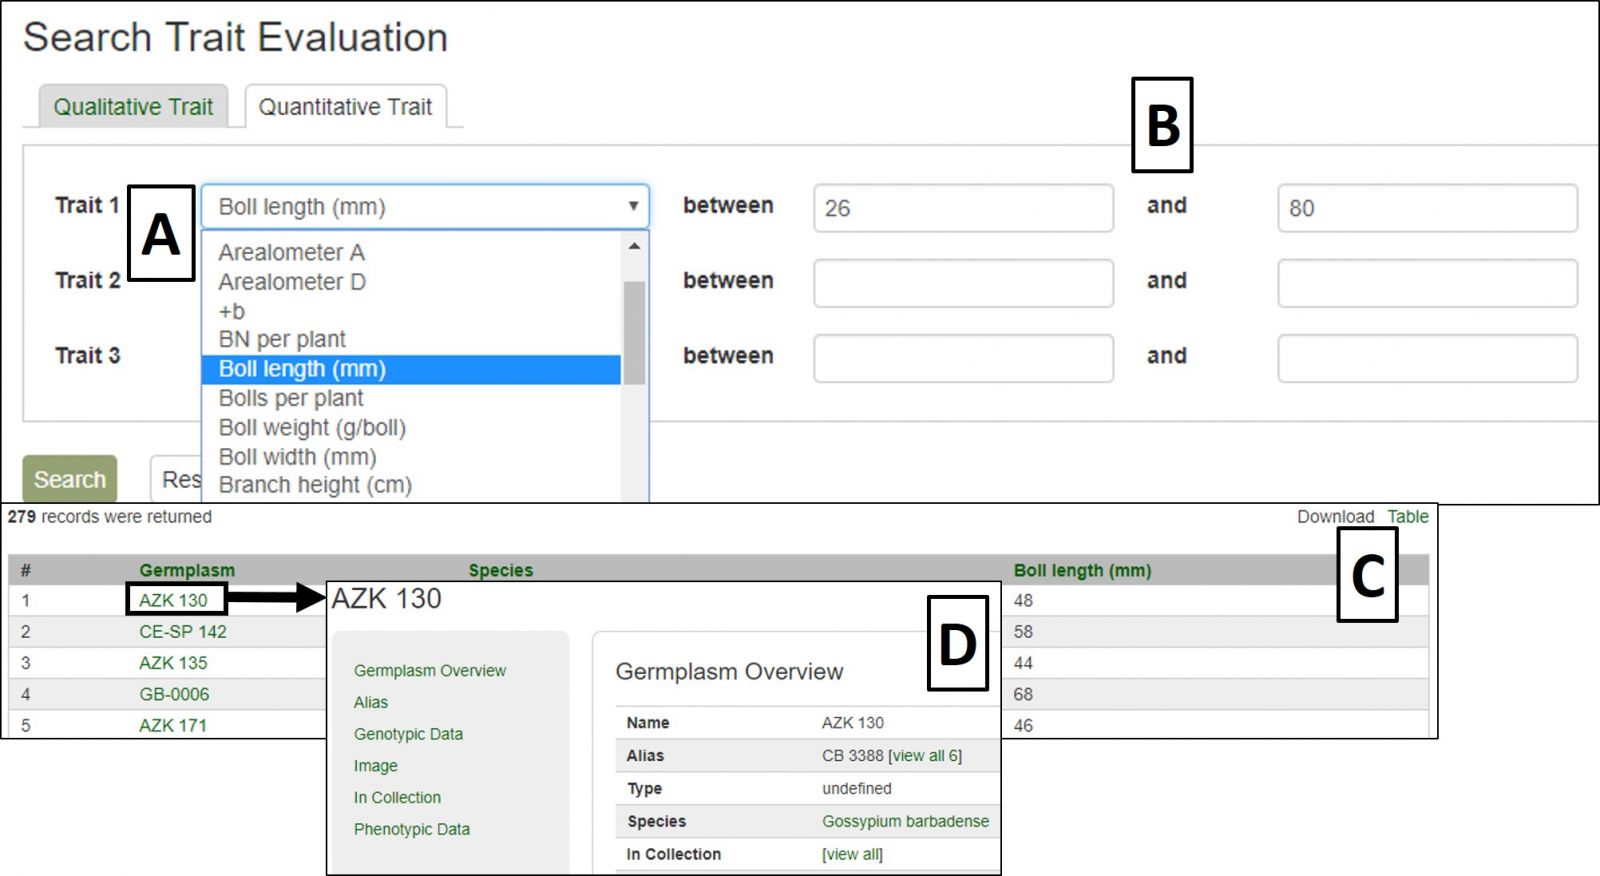
Figure 26. Quantitative Trait Evaluation Search interface and results.
Qualitative Traits are searched by selecting the desired trait or traits from the pull-down menus (Fig. 27A), with the option to filter using available trait descriptors once the search page has auto-updated (Fig. 27B). Results are displayed in a downloadable table (Fig. 27C) with links to further information on evaluated germplasms (Fig. 27D).
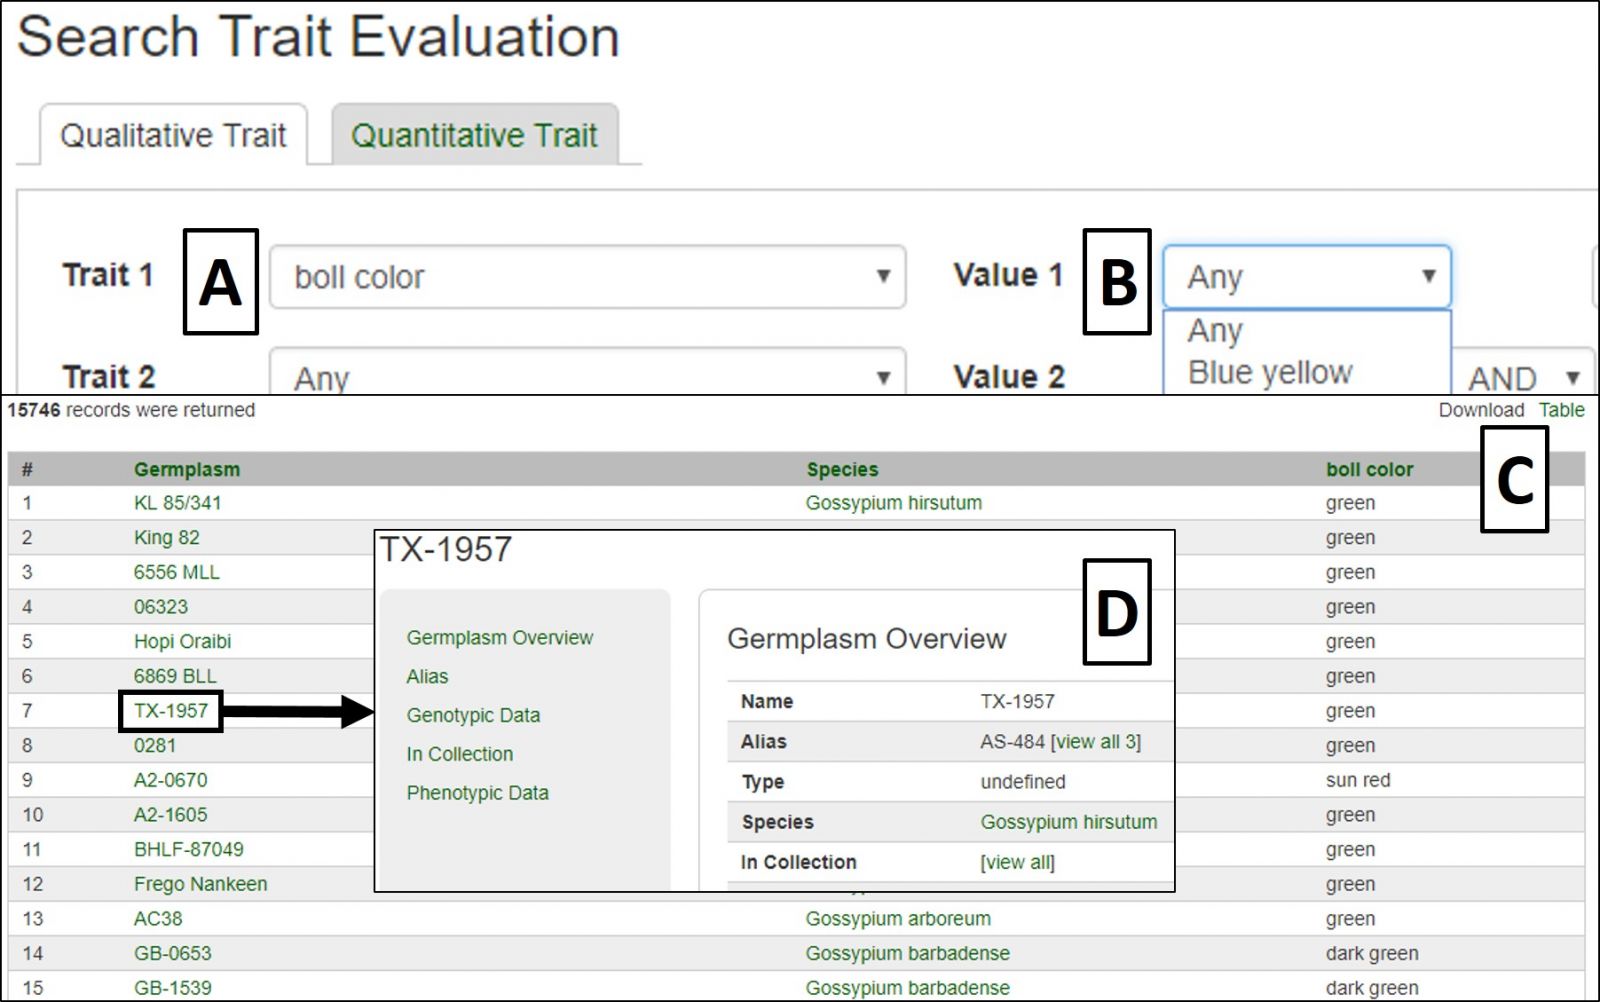
Figure 27. Qualititative Trait Evaluation Search interface and results.
Search Markers by Locus
To search the maps in CottonGen, click on the Search menu in the header and select Search Map.
Tools
To access the different Tools available on CottonGen, click on the 'tools' menu in the header and then select the tool you want to use. Many of the tools are also quickly accessed through links in the 'Tools Quick Start' section on the CottonGen homepage. To learn more about each search tool, please see the links below the figure.
BLAST
CottonGen offers BLAST with genome, transcriptome, peptide and marker sequence databases from Gossypium species. This can be done using nucleotide sequences (Fig. 29A) or peptide sequences (Fig. 29B). BLAST functionality is similar to that on NCBI, and information on advanced settings can be found in the NCBI BLAST Help manual.
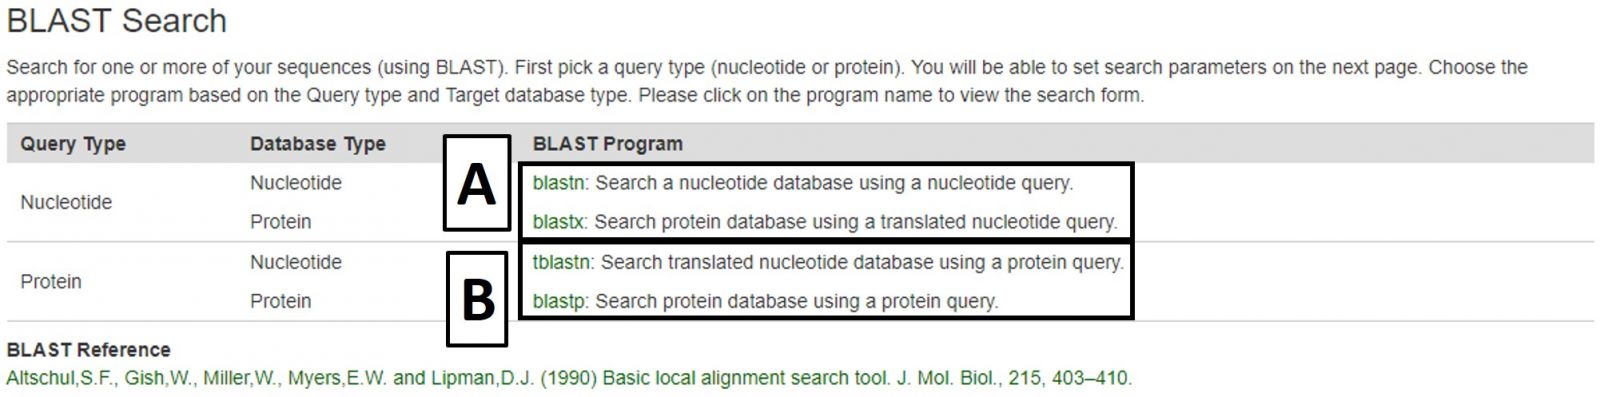
Figure 29. BLAST menu on CottonGen.
The new Tripal BLAST module displays results in an interactive interface where target hit alignment and quality can be viewed (Fig. 30A). Features that are in the CottonGen database will have links to their CottonGen entries where further information can be found (Fig. 30B), and alignments to genome scaffolds that are in CottonGen JBrowse will have links to JBrowse.
.jpg)
Figure 30. BLAST results in CottonGen.
CMap
CMap is used to view and compare genetic maps on CottonGen. CMap can be accessed via the Tools header menu. For more information on using CMap, view this tutorial.
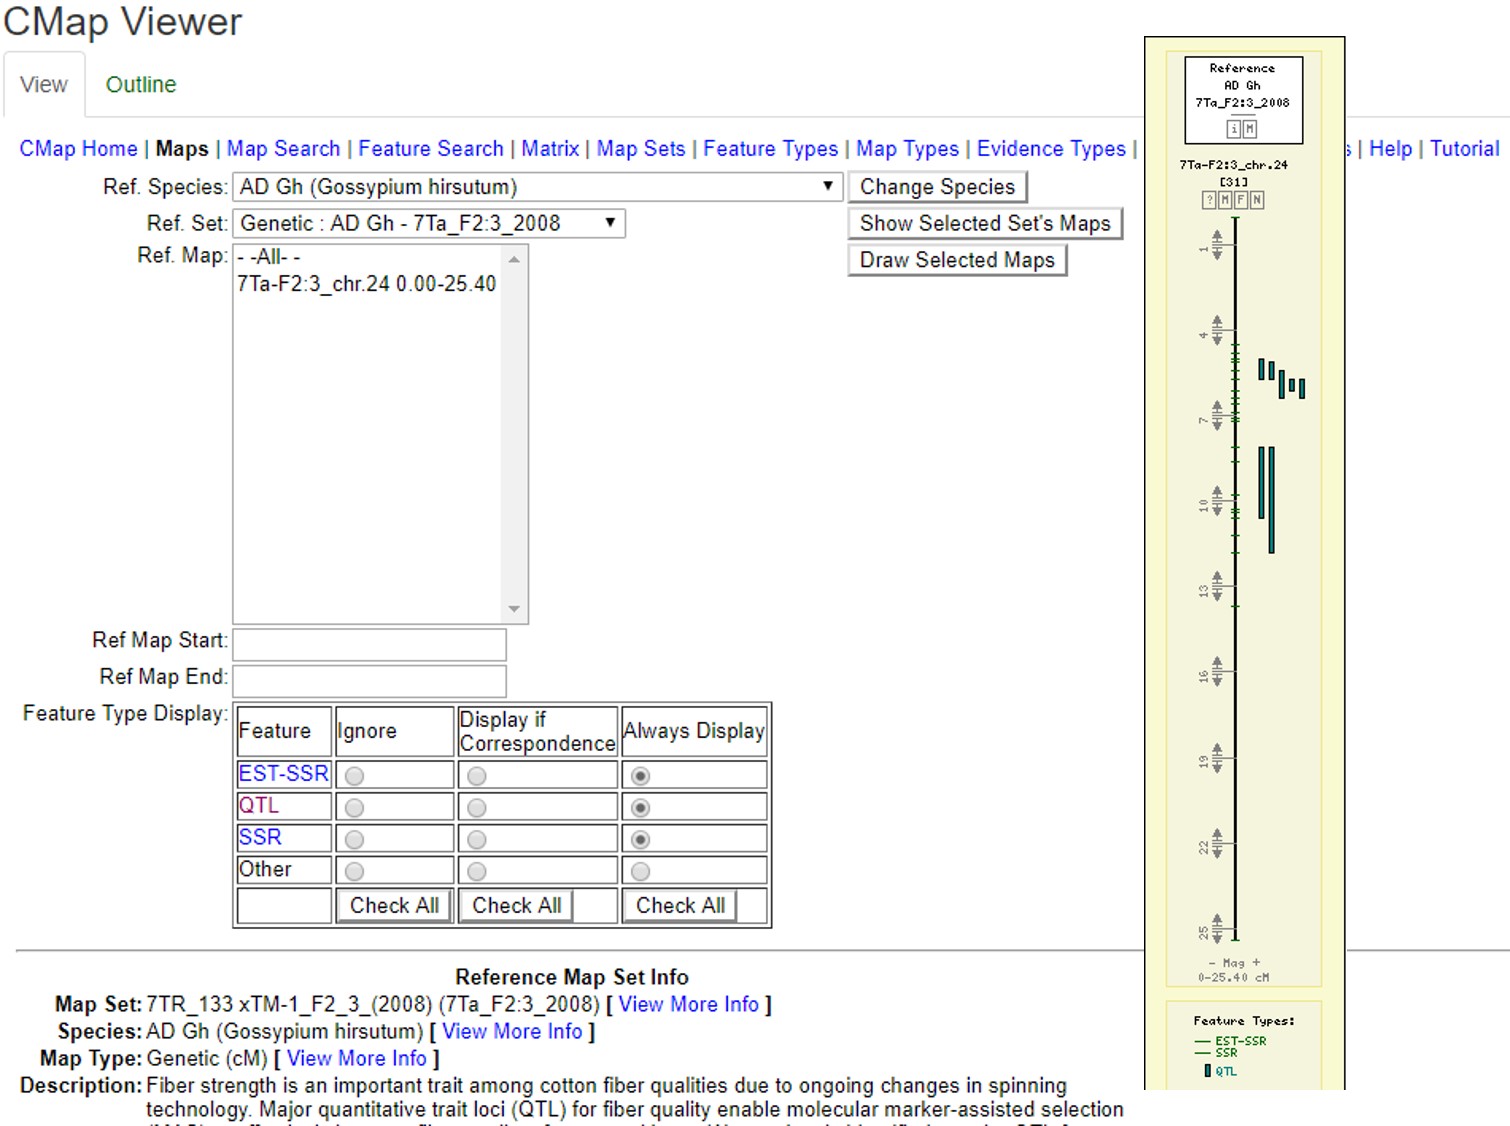
Figure 32. Examples of CMap interfaces on CottonGen.
CottonCyc
CottonCyc pathways were generated using Pathway Tools and are available under the CottonCyc link in the Tools menu. Pathway Tools allows users to view metabolic pathways based on specific genomes. Please see the User's Guide for Pathway Tools for more information on use.
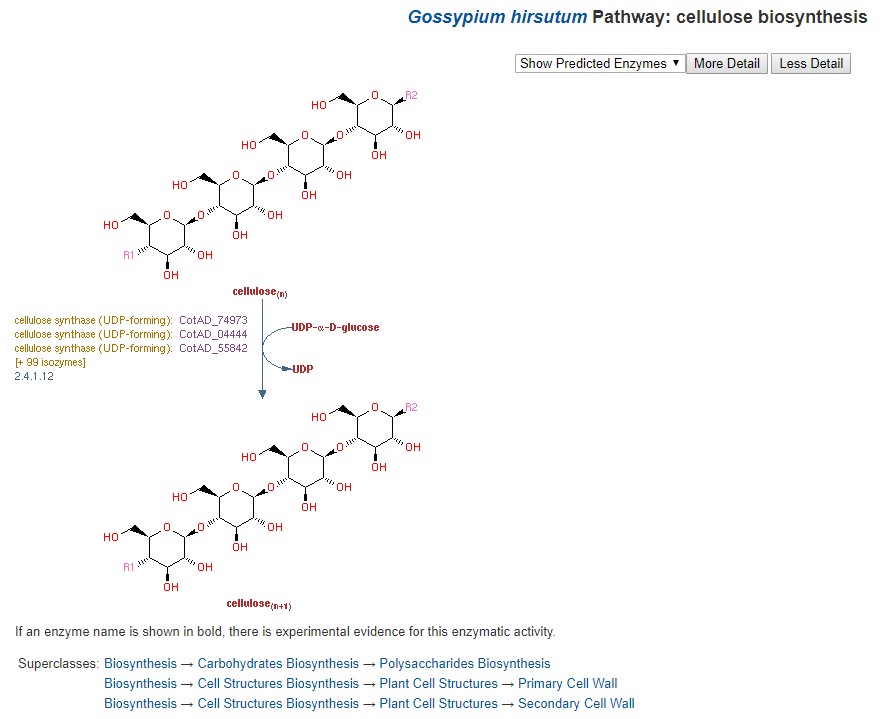
Figure 33. CottonCyc view of cellulose biosynthesis in G. hirsutum.
JBrowse
CottonGen has an instance of the JBrowse genome browser for viewing genome data (Fig. 31). A list of the genomes available in CottonGen can be accessed by clicking the JBrowse link in the Tools menu. Please watch the JBrowse tutorial for more details about how to navigate and use JBrowse.
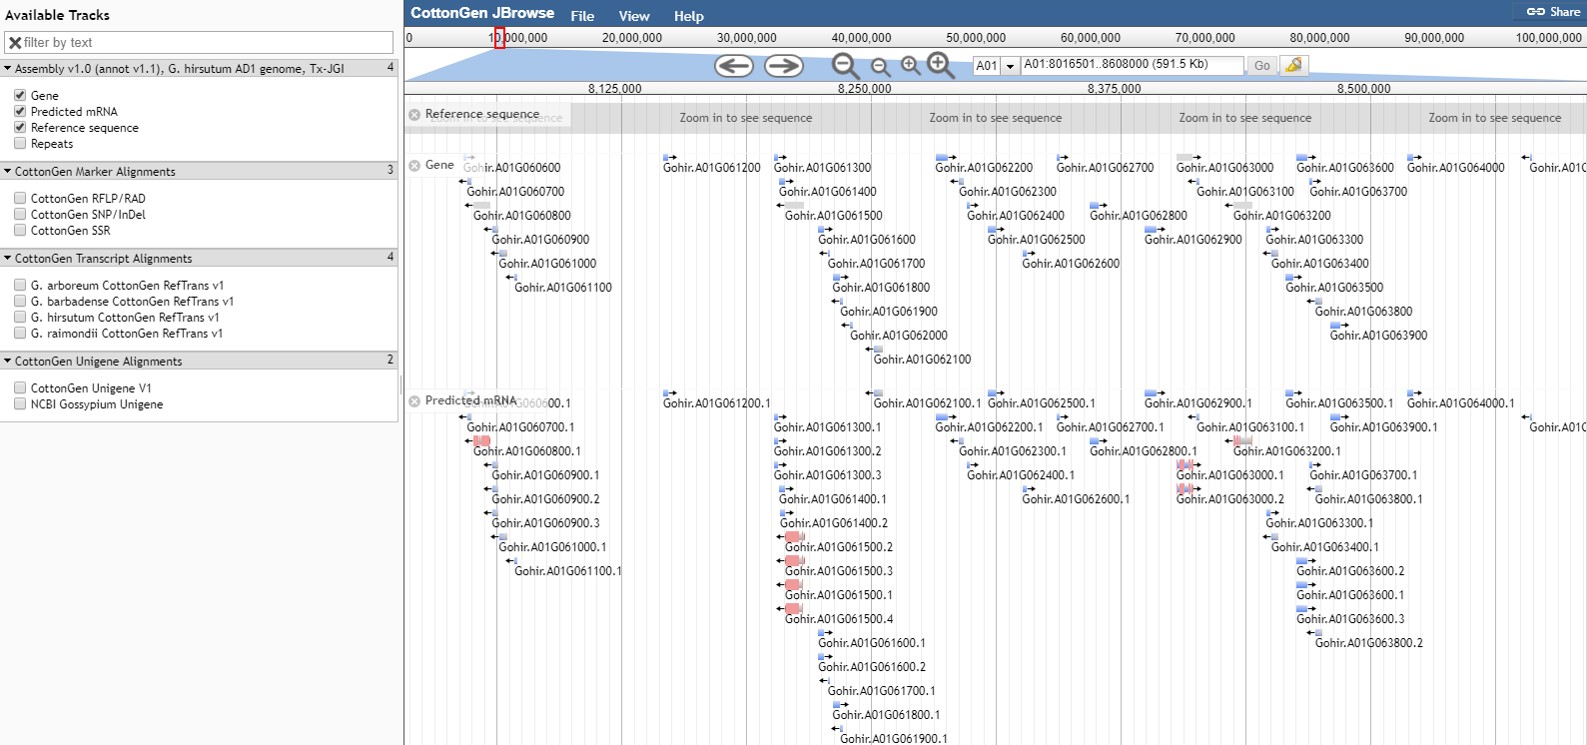
Figure 31. JBrowse view of G. hirsutum AD1 genome Tx-JGI assembly in CottonGen.
Read more about JBrowse and data format:
Map Viewer
MapViewer is a new tool for viewing genetic maps on CottonGen. It can be accessed from multiple locations including the Tools header menu (Fig. 34A) and in the Tools section of Species Overview pages (Fig. 34B). From the MapViewer main page, clicking Sample Map will bring up a default map display that can be adjusted as described below.
.jpg)
Figure 34. Accessing MapViewer in CottonGen.
It can also be accessed via Search Map in the Search header menu (Fig. 35A) and then choosing the desired map. The Map Overview page displays a summary graphic of all linkage groups (Fig. 35B) and clicking a linkage group opens a detailed view in MapViewer.
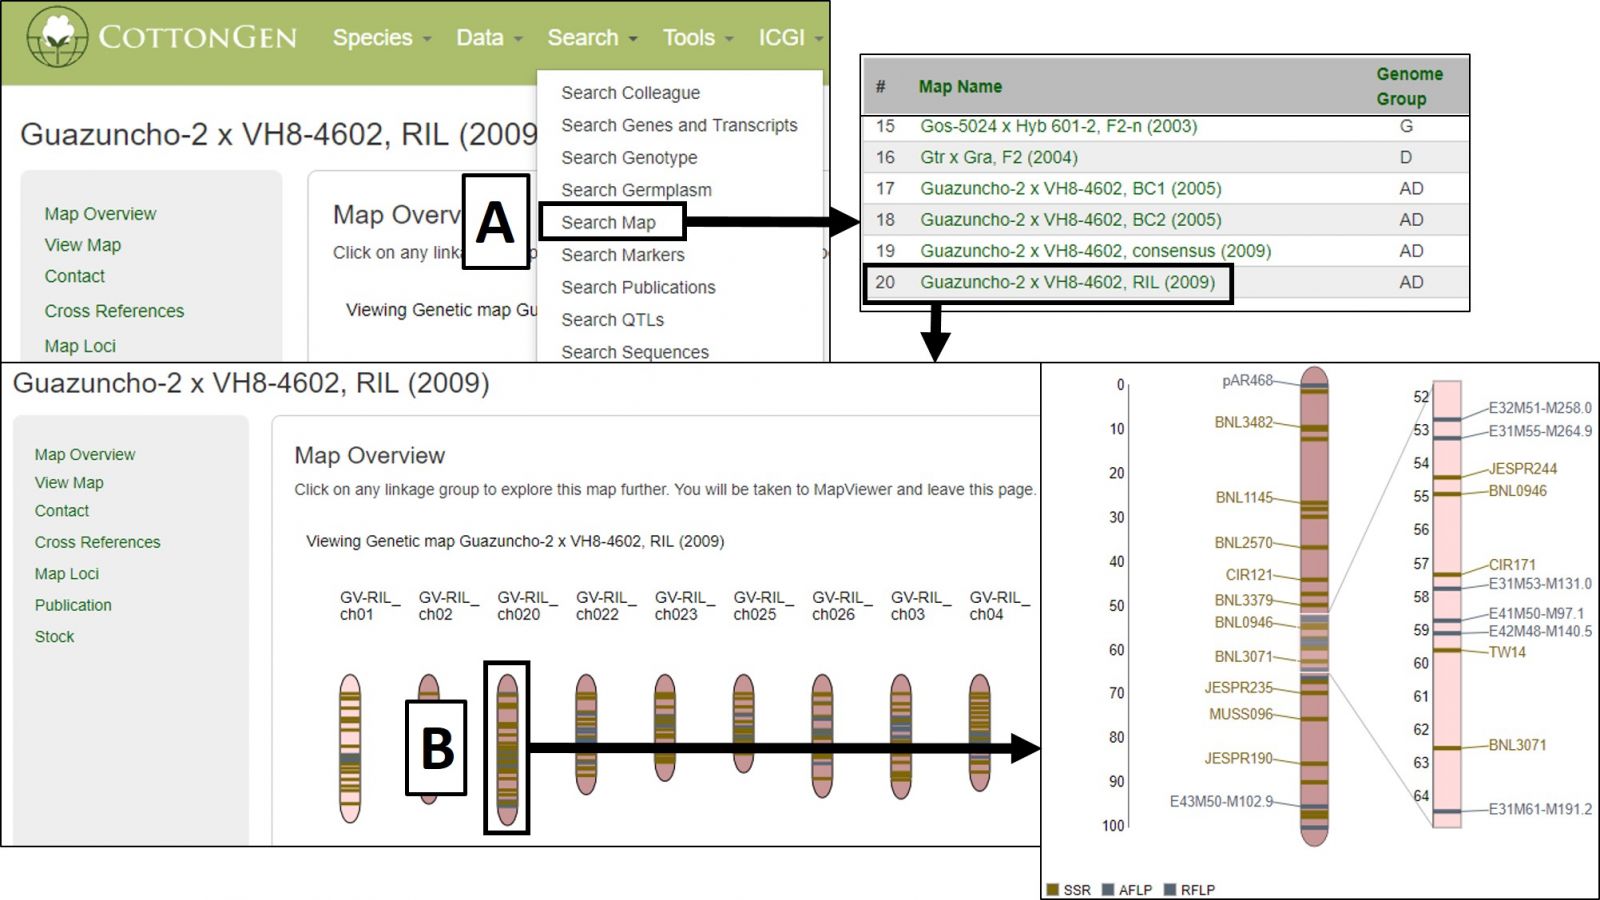
Figure 35. Accessing and using MapViewer in CottonGen.
MapViewer displays the complete linkage group on the left and a highlighted region on the right (Fig. 36). This region can be changed by clicking and dragging on the linkage group over the desired area. There is a legend for the marker colors in the bottom left corner (Fig. 36A). Information about a marker is displayed when the cursor is over its name in the highlighted region (Fig. 36B) and clicking that name will open the marker's Overview page. Displayed markers can be hidden or shown based on marker type, and their highlight colors changed, using the Display Settings at the bottom of the page (Fig. 36C).
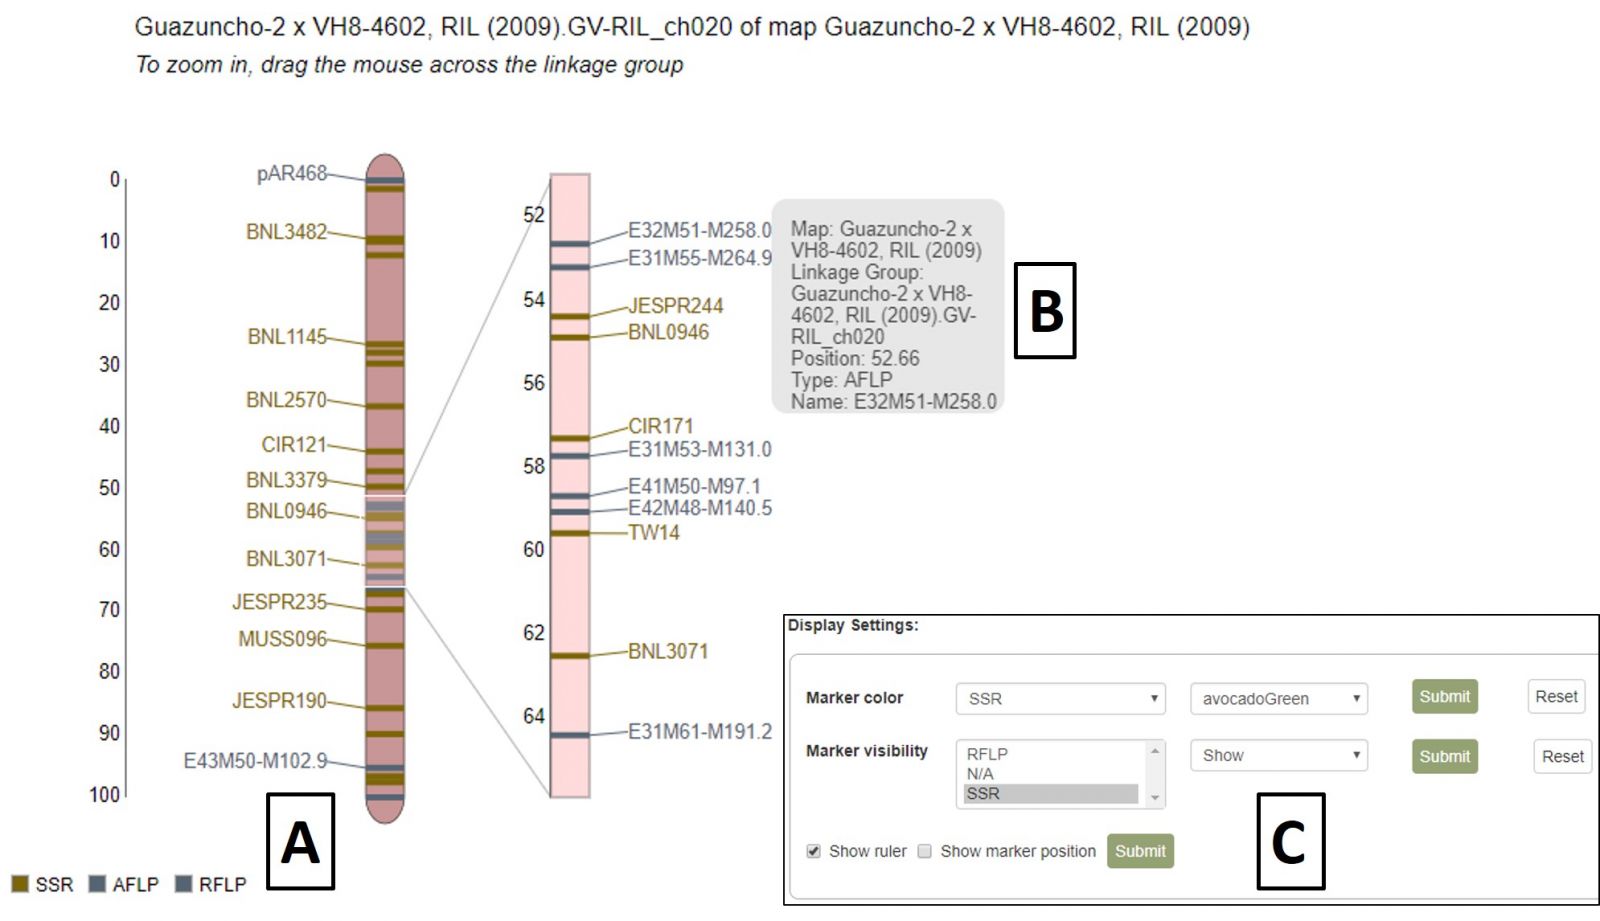
Figure 36. MapViewer static linkage group (left) and dynamic highlight region (right).
A different map or linkage group can be displayed using the controls at the bottom of the MapViewer page (Fig. 37A). When changing the broader categories of Species or Map, the website will take a moment to update the available selections in the subcategories. After changing map selections, the Submit button must be pressed to update the display. MapViewer can also display a comparison map alongside your original selection by checking the "Show comparison map" box (Fig. 37B) and selecting the desired map and linkage group.
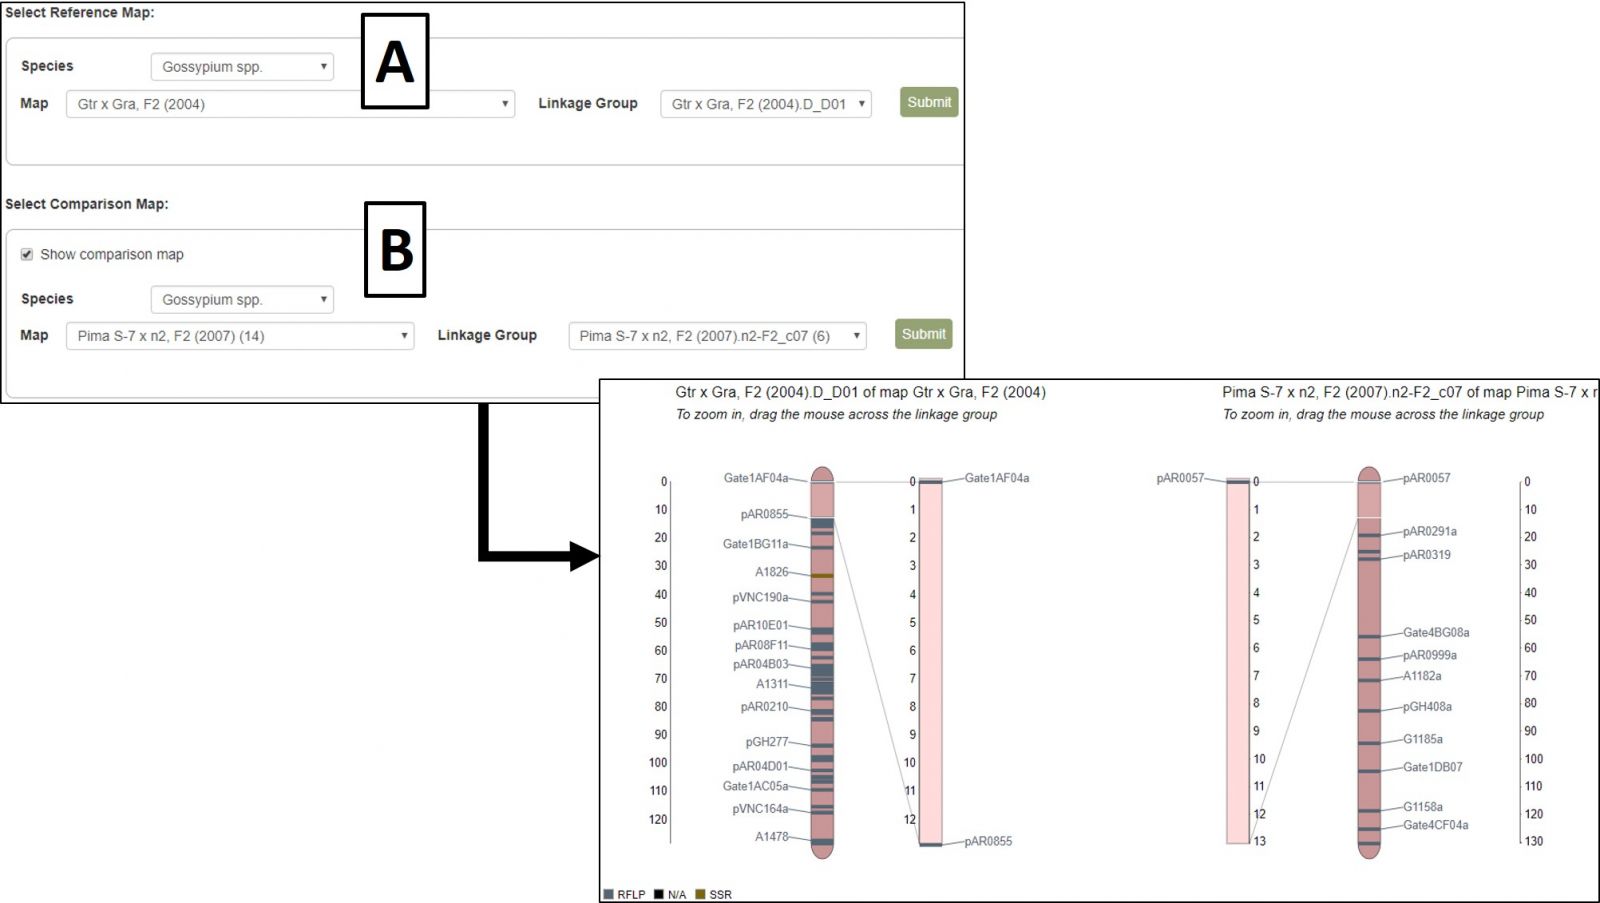
Figure 37. Changing map/linkage group and displaying comparison maps in MapViewer.
Synteny Viewer
Conserved syntenic regions among publicly available cotton genomes were analyzed by CottonGen and made available using the Tripal Synteny Viewer developed by the Fei Bioinformatics Lab from the Boyce Thomson Institute at Cornell University. Analysis was done using MCScanX (Wang et al. 2012) with default settings and blast files were made using blastp with an expectation value cutoff < 1e-10, maximum alignment of 5, and maximum scores of 5.
The synteny viewer displays all the conserved syntenic blocks between a selected chromosome of a genome and another genome in a circular and tabular layout. Once a block is chosen in the circular or tabular layout, all the genes in the block are shown in a graphic and tabular format. The gene names have hyperlinks to gene pages where detailed information of the gene can be accessed. The ‘synteny’ section of the gene page displays all the orthologs and the paralogs with link to the corresponding syntenic blocks or gene pages.
SyntenyViewer can be accessed from multiple locations including the Tools header menu (Fig. 38A) and in the Tools section (Fig. 38C) of Species Overview pages (Fig. 38B)
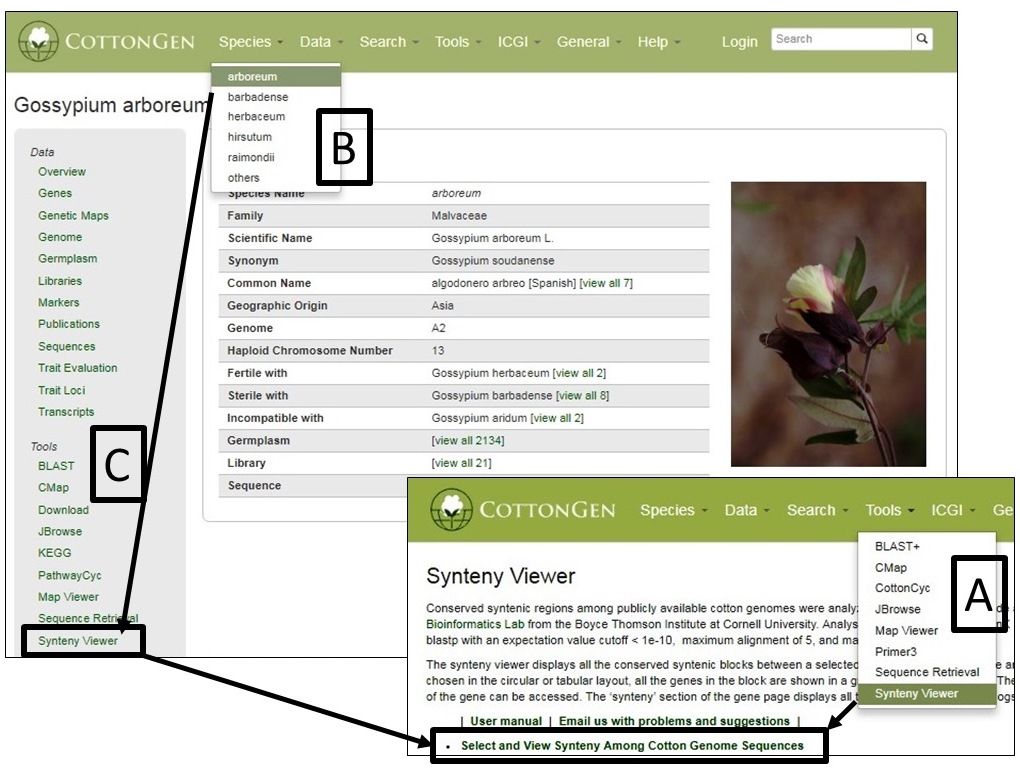
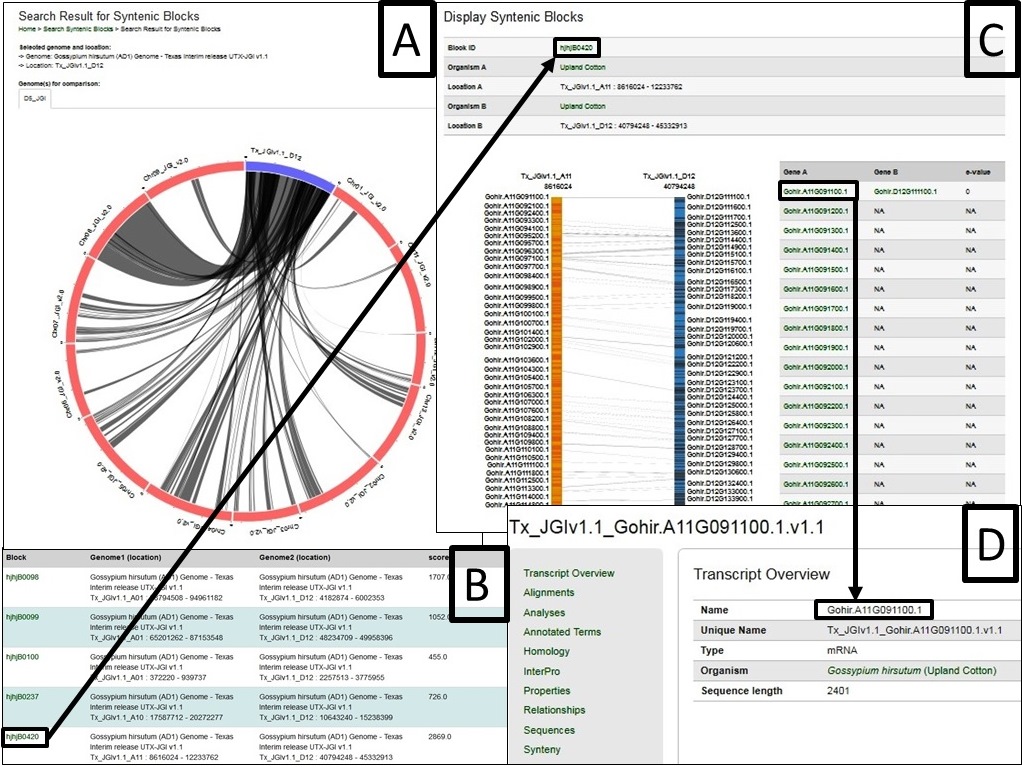
From the SyntenyViewer main page, clicking Select and View Synteny Among Cotton Genome Sequences will bring up Syntenic Blocks Search Page (Fig. 39). There are two ways to search and view Syntenic Blocks: One is searching by a genome (Fig. 39A) and a chromosome/scaffold of it (Fig. 39B), and (a) genome(s) for the comparison (Fig. 39C); The other way is to view a block by search its ID (Fig. 39D)
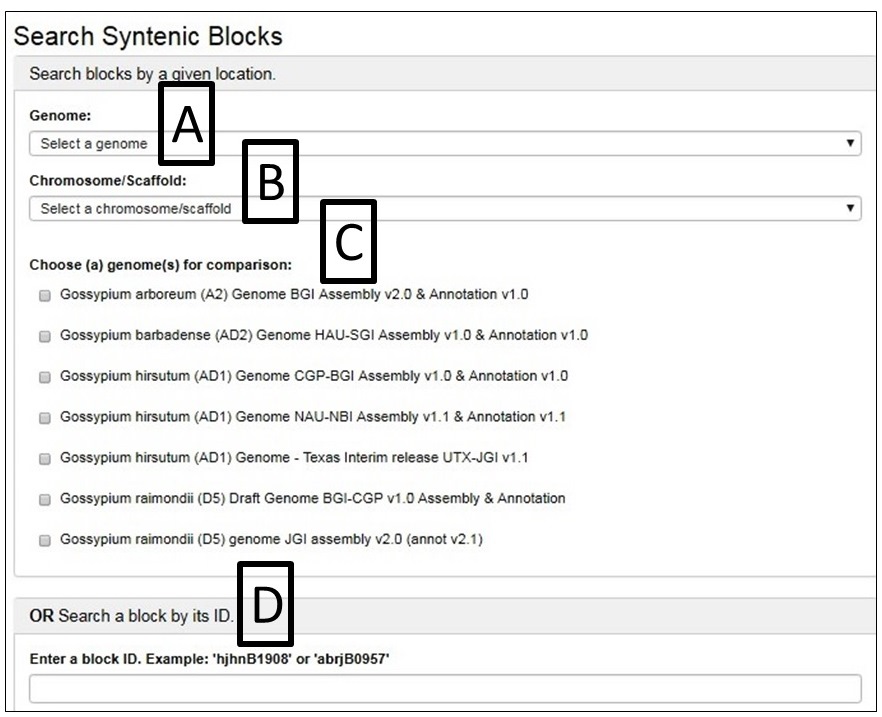
Fig. 40 gives an example as the chromosome Dt 12 of AD1-UTX-JGI genome is selected and compared by the D5-JGI genome. A. the the syntenic blocks in circle plot; B. Information table of pair-wised collinear blocks; C. Gene names involved in a specific block ID and display; D. Gene names are linked to CottonGen
Video Tutorials
CottonGen specific videos are in progress, but please check out the tutorial videos for our other databases on the Main Lab YouTube channel. The searches use the same framework across all of our databases. New videos are released every month except the months we send out quarterly newsletters. The newest video and links to key ones are featured below.
BIMS (Breeding Information Management System)
BIMS: Accessing BIMS
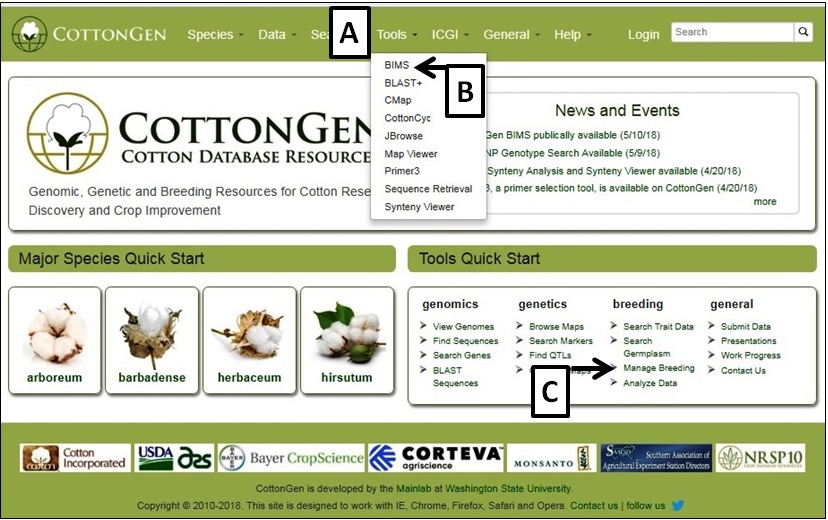
To access BIMS, either simply click on the "Tools" menu (Fig. 1A) and then select "BIMS" (Fig. 1B), or via the Manage breeding link on the Tools Quick Start (Fig. 1C) on the home page. The BIMS interface will then open. Public data is available for all users of CottonGen without requiring an account. Users can download public data from BIMS without an account, but will need a CottonGen user account to save the results. Access to private breeding data also requires users to login with their CottonGen user account. To create a breeding program, users need to create a CottonGen account and contact using the contact form for breeder privilege.
Figure 1. How to access BIMS on CottonGen
BIMS: Viewing Data
There are three main areas of the BIMS interface. The first part is the header region (Fig. 2A) which displays the current program, allows users to change their selected program, has a link to the CottonGen homepage (Site Home), and displays the user name. The second part of the interface is the accordion menu on the left side (Fig. 2B). This menu allows users to switch between different sections of the BIMS program. The last region is the tab region (Fig. 2C) and this is where users primarily interact with BIMS. Each tab in BIMS has an "Instructions" section that can be expanded by clicking on it. The "Instructions" have information on how to use that tab.
Figure 2. The main parts of the BIMS interface
.jpg)
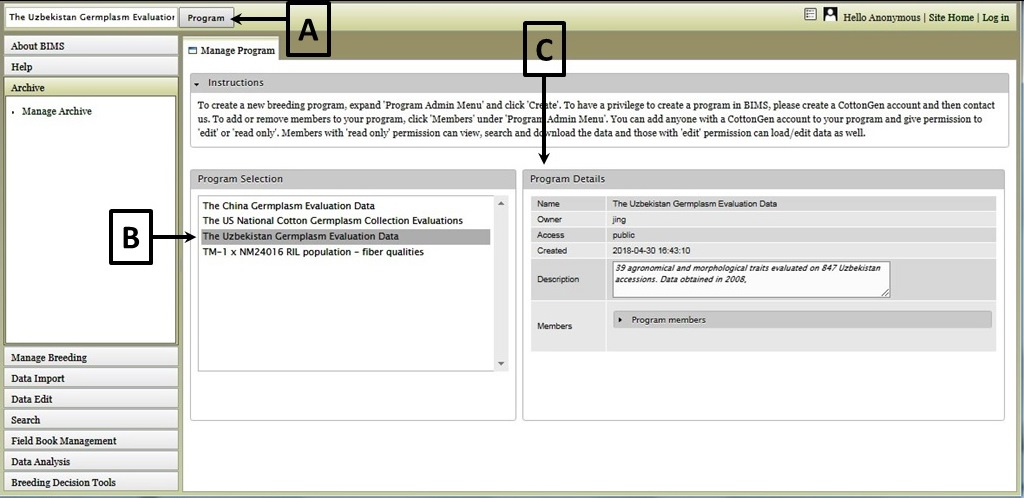
To view data that has already been loaded into BIMS, you first need to select a breeding program (Fig. 3A). Once selected, the program name will appear in the header of the BIMS window (Fig. 3A). You can change the program by clicking on the "Program" button next to the program name, then selecting a different program from the Manage Program window (Fig. 3B). Details of the selected program will be displayed once a new selection is made (Fig. 3C).
Figure 3. Selecting a Program in BIMS
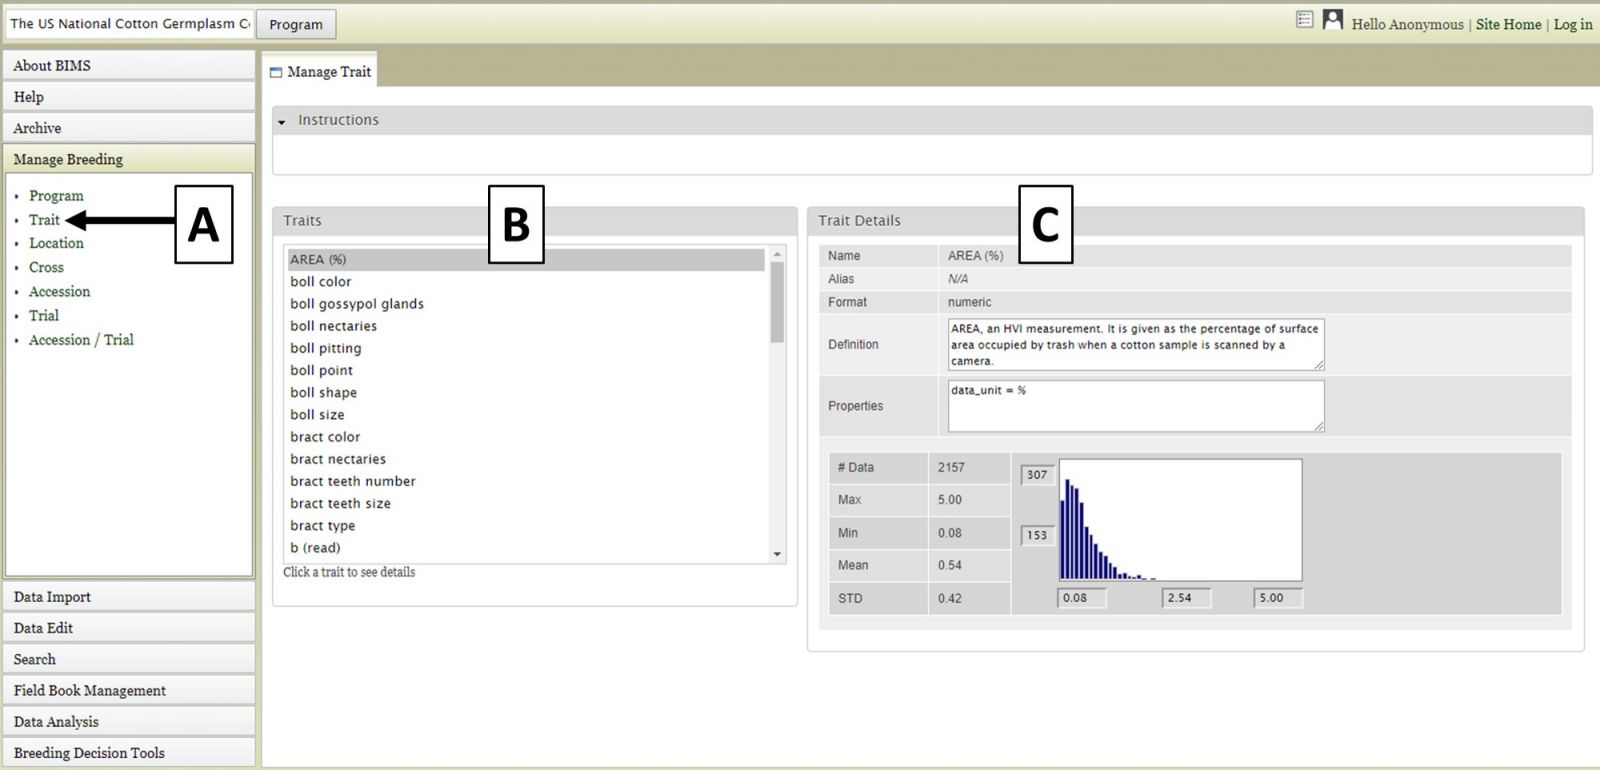
Once the program has been loaded, you can explore data that has been loaded into BIMS by clicking on the "Manage Breeding" section of the accordion menu. Under "Manage Breeding" there are links to view information about the Program, Trait, Location, Cross, Accession, and Trial. To view information about a certain trait, click on "Trait" (Fig. 4A) and the "Manage Trait" tab will appear. In that tab, click on the trait of interest (Fig. 4B). Once a trait is selected, the "Trait Details" will be displayed (Fig. 4C). If you are viewing data from a private breeding program, you can also edit the information for all the items under Manage Breeding. Breeders with private breeding programs will also see an "Actions" section under the details window. The "Actions" section allows breeders to edit the properties or delete the item.
Figure 4. Selecting and viewing Trait Details
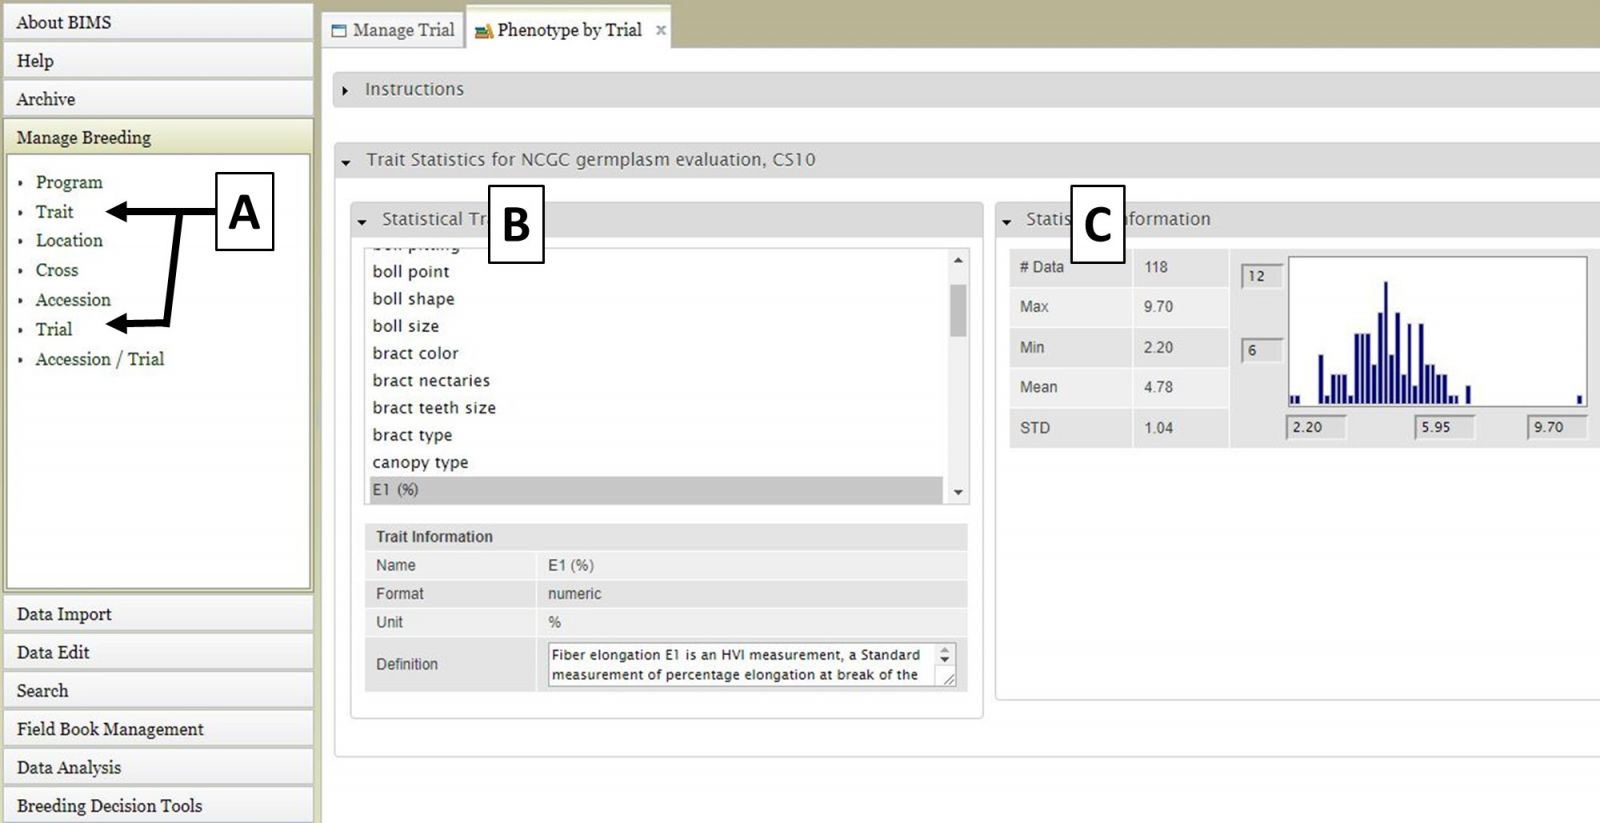
You can also view information specific to multiple data types, such as Trait data from a particular trial within a program. For example, in Figure 5 we are viewing E1 (%) trait data that is only from the CS10 trial of the US National Cotton Germplasm Collection Evaluations program. To do this, you would select Trial from the accordion menu (Fig. 5A) and then "NCGC germplasm evaluation, CS10" and click "View" in the tab area, then select Trait from the accordion menu (Fig. 5A) and finally choose E1 (%) from the tab area (Fig. 5B). Details will be displayed to the left (Fig. 5C).
Figure 5. Viewing data specific to multiple data types
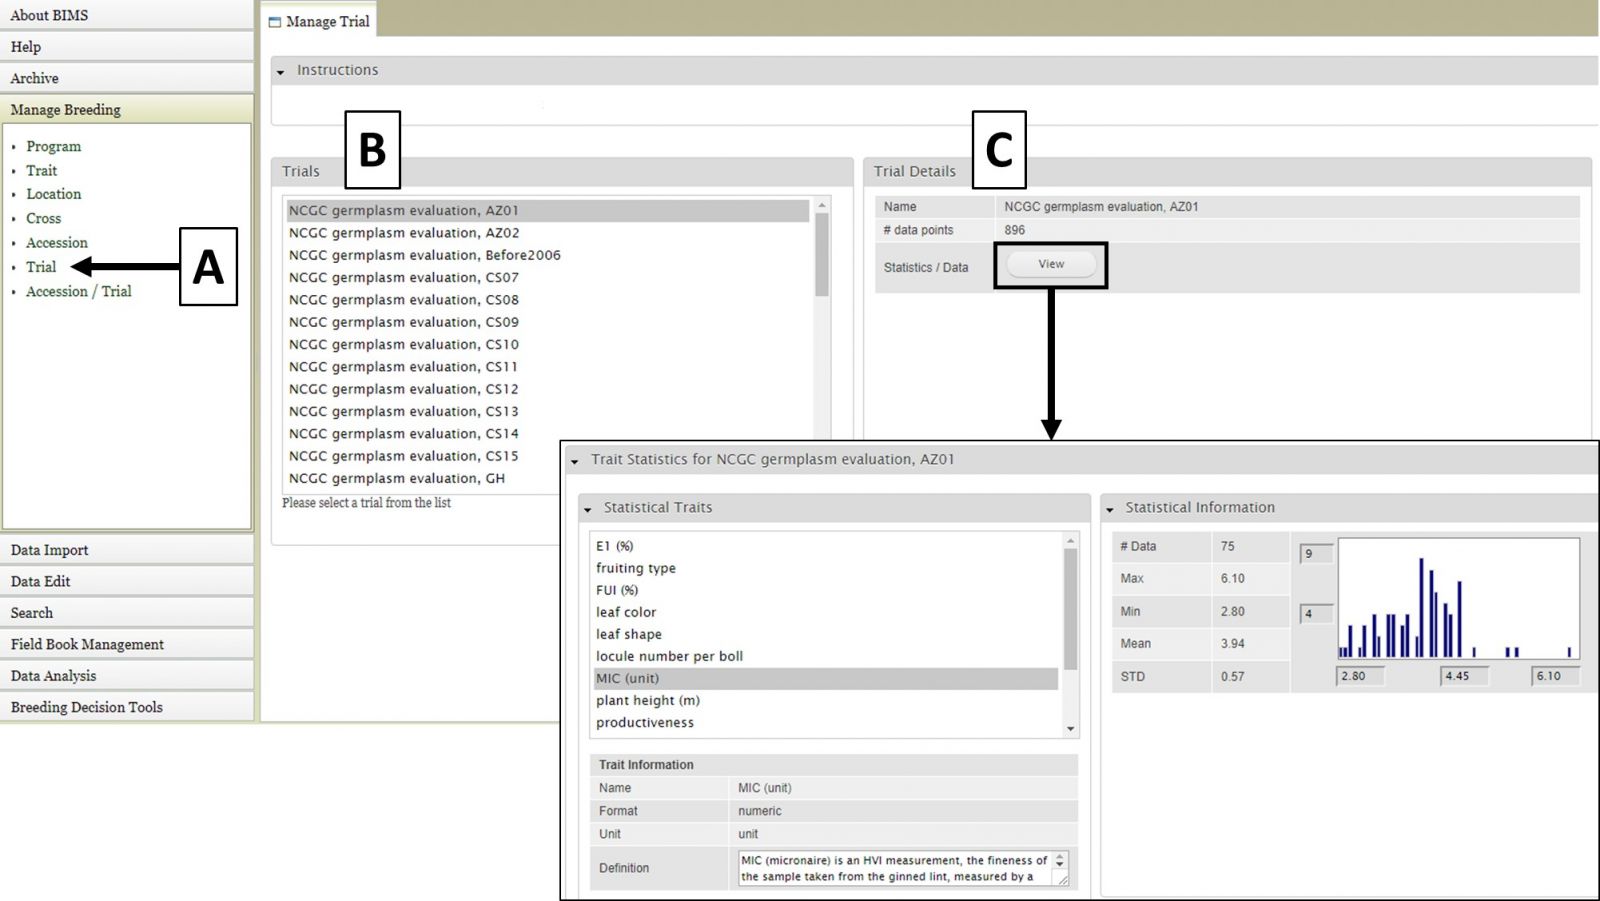
For the "Cross", "Accession", and "Trial" data types, the data details are accessed the same way. First select the data type under "Manage Breeding" (Fig. 6A), then select one of the names (Fig. 6B), and then the details will appear (Fig. 6C). For these data types, in the "Details" section there is also a "View" button that opens another tab that displays further statistics/data.
Figure 6. Location details
BIMS: Searching Data
You can search the data in a breeding program using BIMS. Click on the "Search" section of the left side accordion menu and then click on "Accession" (Fig. 7A). This will open the "Search Accession" tab (Fig. 7B).
Figure 7. Opening the Search tab
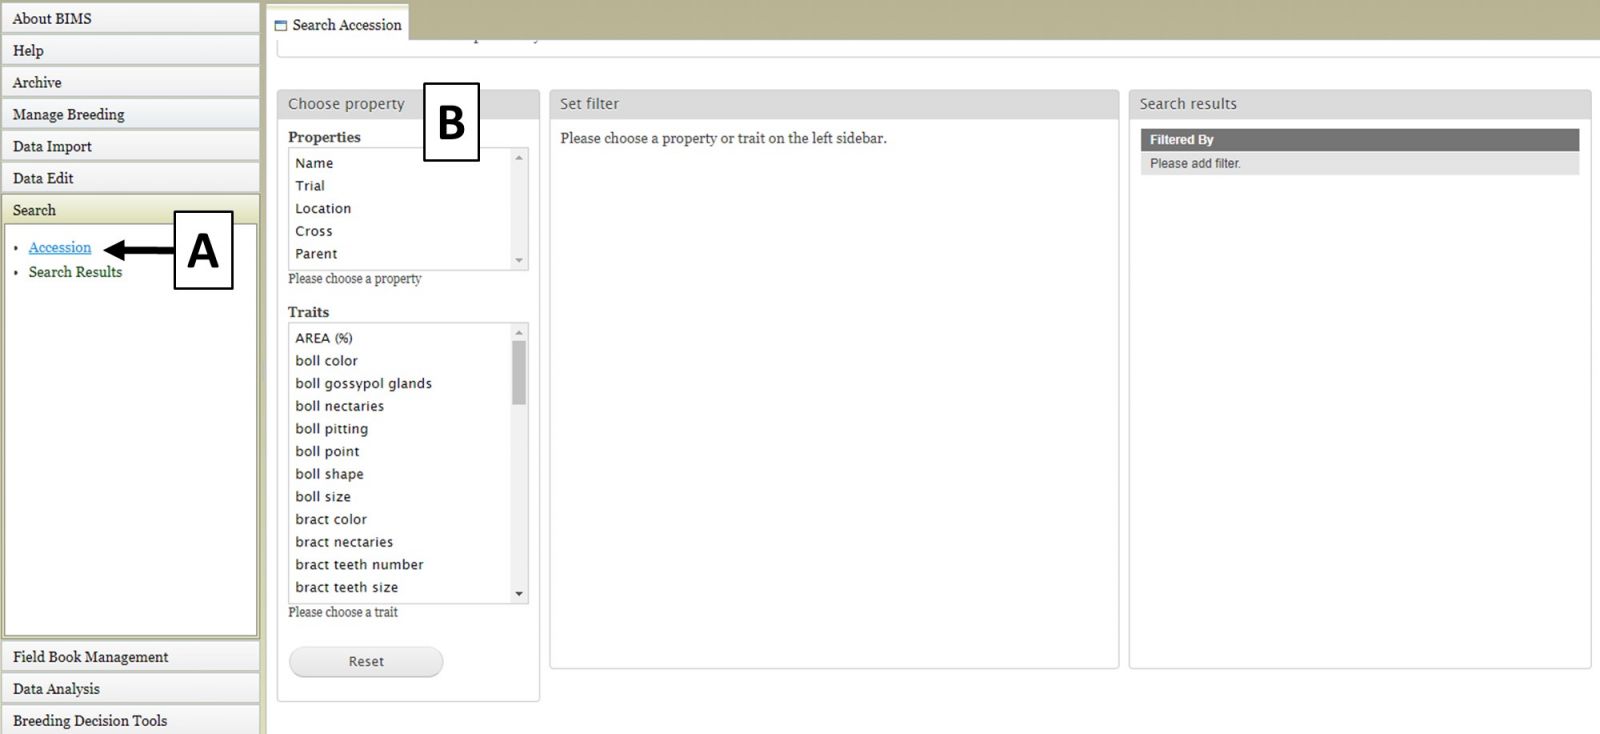
The first step to start a search is to select a property or trait under the "Choose property" section (Fig. 8A). In this example, we are choosing "Parent." After the property is selected, the "Set filter" section will populate with options for that data type (Fig. 8B). After selecting the options you want, click "Add." The selected filter will then appear in the "Search results" section. If you want to reset the search, click the "Reset" button (Fig. 8C).
Figure 8. Selecting a Property and setting a Filter in the Search Tab
.jpg)
You can further filter the search results by adding another property or trait under the "Choose property" section. In this example, we are further refining the search by adding the "boll color" trait (Fig. 9A). The "Set filter" section will show the data that are relevant for the previous filter you chose. For example, the statistics shown for "boll color" trait here is only for those accessions from the parents you chose in the previous search. You can choose which values for boll color to filter by, or for data that is numerical you can set the minimun and maximum value for that trait, and then click "Add" (Fig. 9B). The new filter is added to the "Search results" section and the selected filters can be removed with the "Remove" button under "Search results" (Fig. 9C). To view the search results, and to generate a file to export, click on "View" under "Search results" (Fig. 9C).
Figure 9. Adding more filters to the search and viewing results
.jpg)
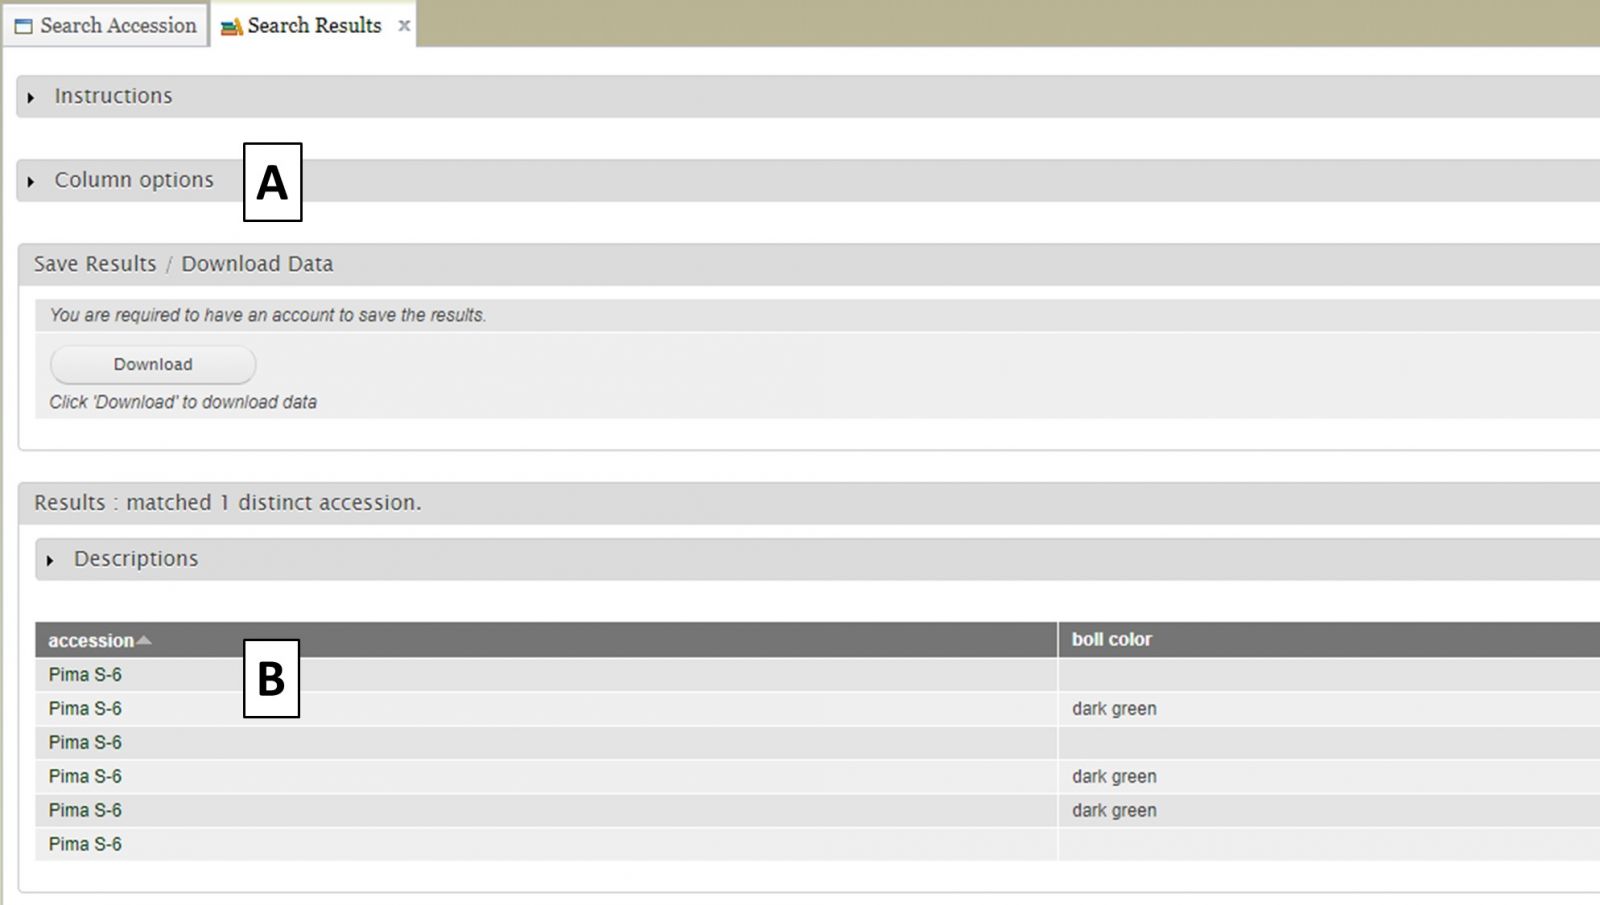
When the "View" button is clicked (Fig. 9C), a new tab opens called "Search Results" (Fig. 10). On this tab there is a "Column options" section (Fig. 10A) and a preview of the data table (Fig. 10B).
Figure 10. Search Results tab
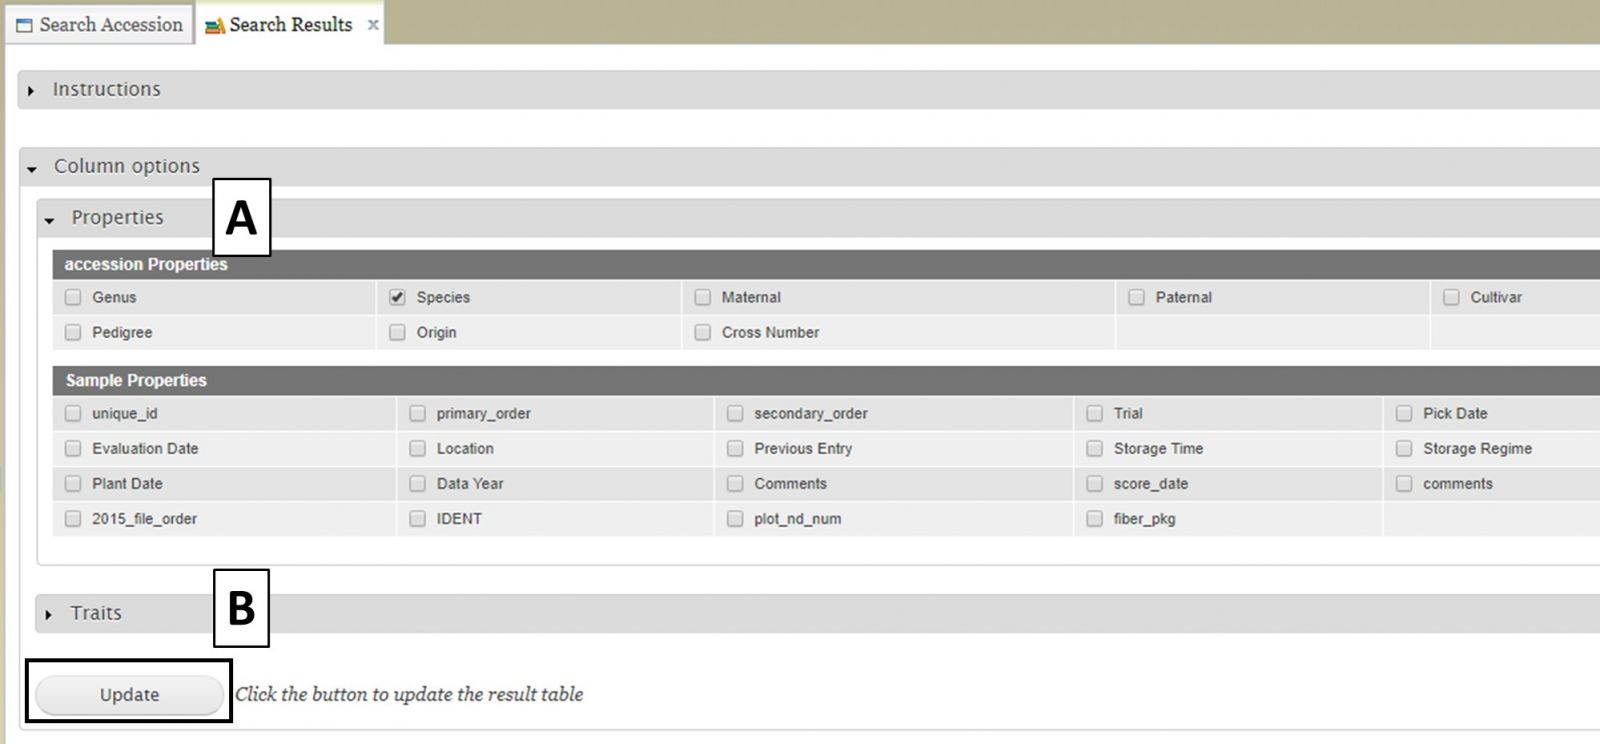
Users can add more information to the table before exporting the data. To do this, click on the "Column options" section to expand it (Fig. 11). There are two sections, "Properties" (Fig. 11A) and "Traits" (Fig. 11B). You can select additional items to display by clicking on the check boxes in these two sections. Once all the selections have been made, click "Update".
Figure 11. Adding more columns to search results table with Column Options section
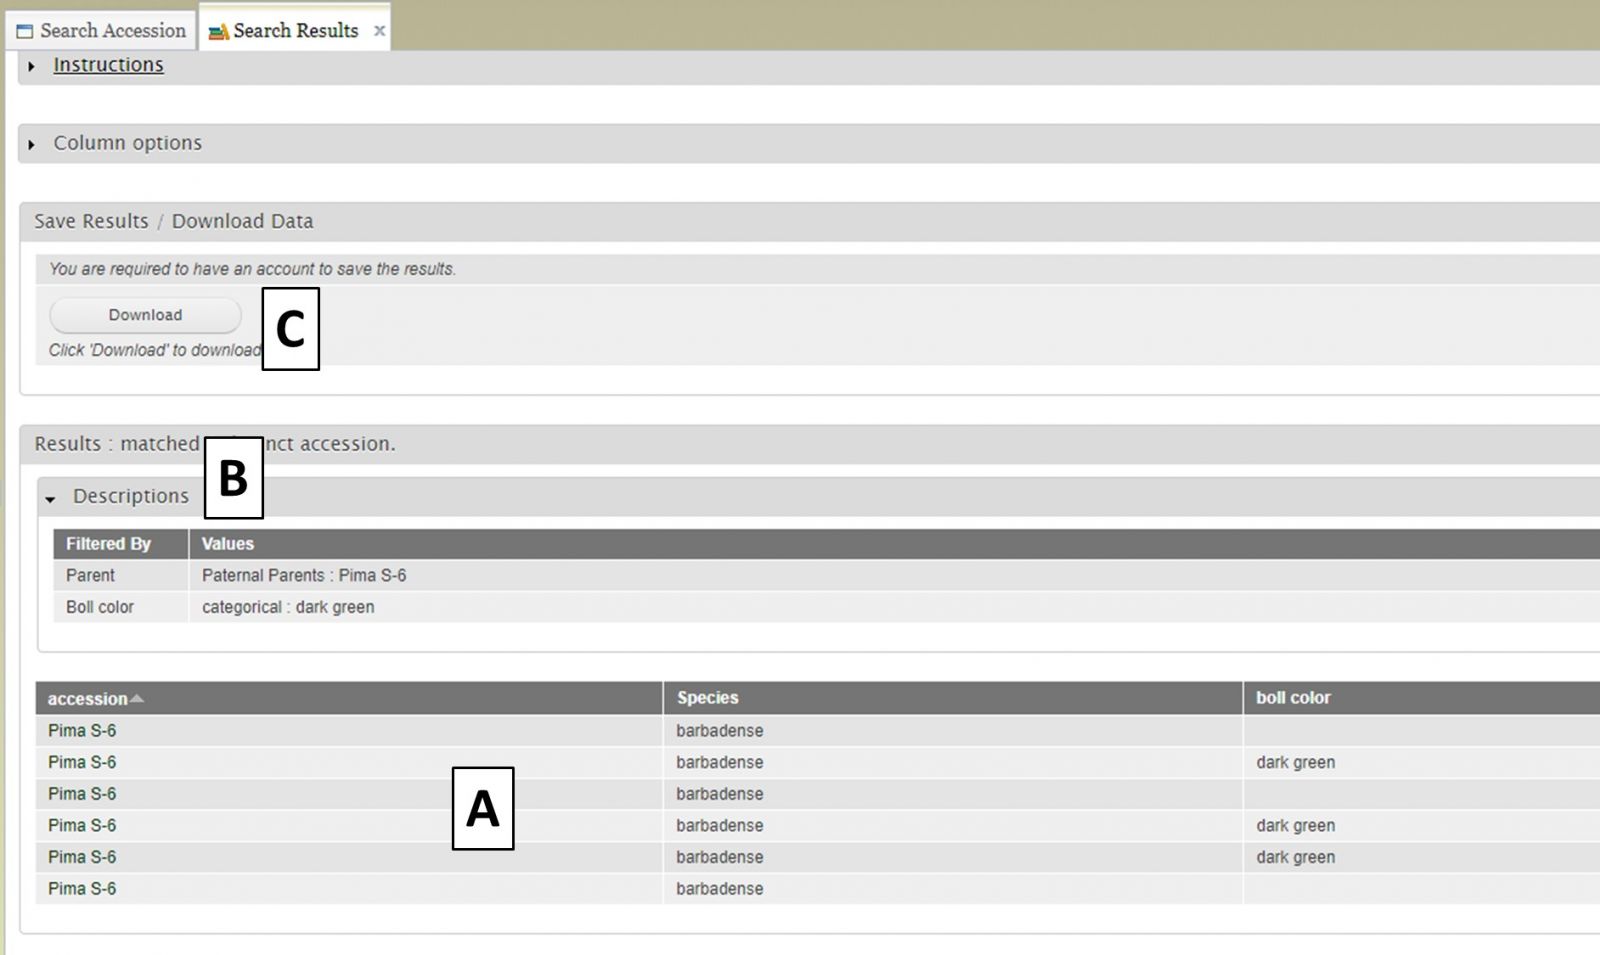
After selecting additional data to display on the table, you can preview the table on the "Search Results" tab (Fig. 12A) and see the original filters that were used to generate the initial table by clicking on "Descriptions" in the "Results" section (Fig. 12B). To download the data table, click on the "Download" button in the "Save Results / Download Data" section (Fig. 12C). If you do not see your browser start to downoad the file after clicking "Download," please make sure the pop-up was not blocked.
Figure 12. Downloading data from the Search Results tab
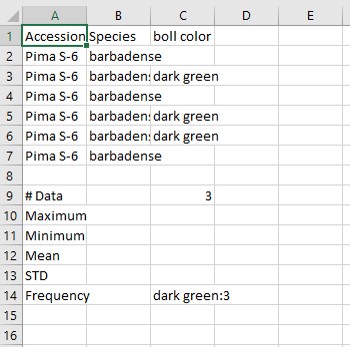
BIMS generates a CSV file of the search results table (Fig. 13). This table is easily opened by Microsoft Excel and other programs.
Figure 13. Example CSV file exported from BIMS
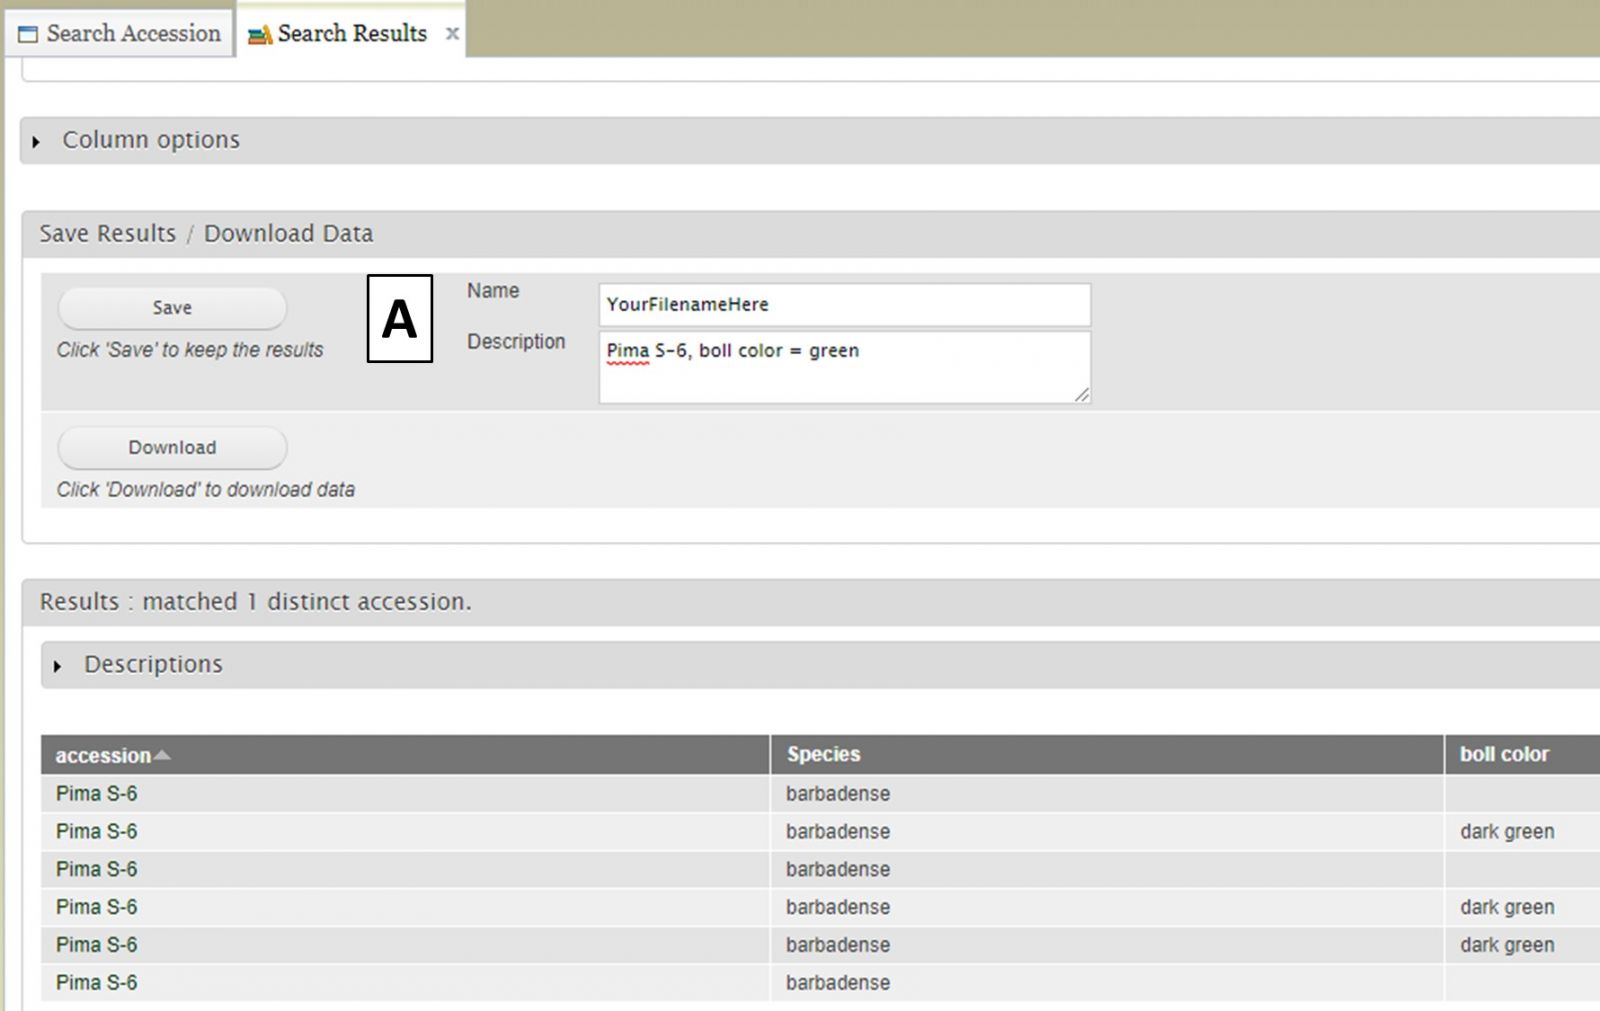
If you have a CottonGen account, you can also save the search results to a list. You will see a "Save" button with boxes for a list name and description (Fig. 14A). This list can be saved to either a private or public program that you are in.
Figure 14. Saving lists from searches to private breeding programs
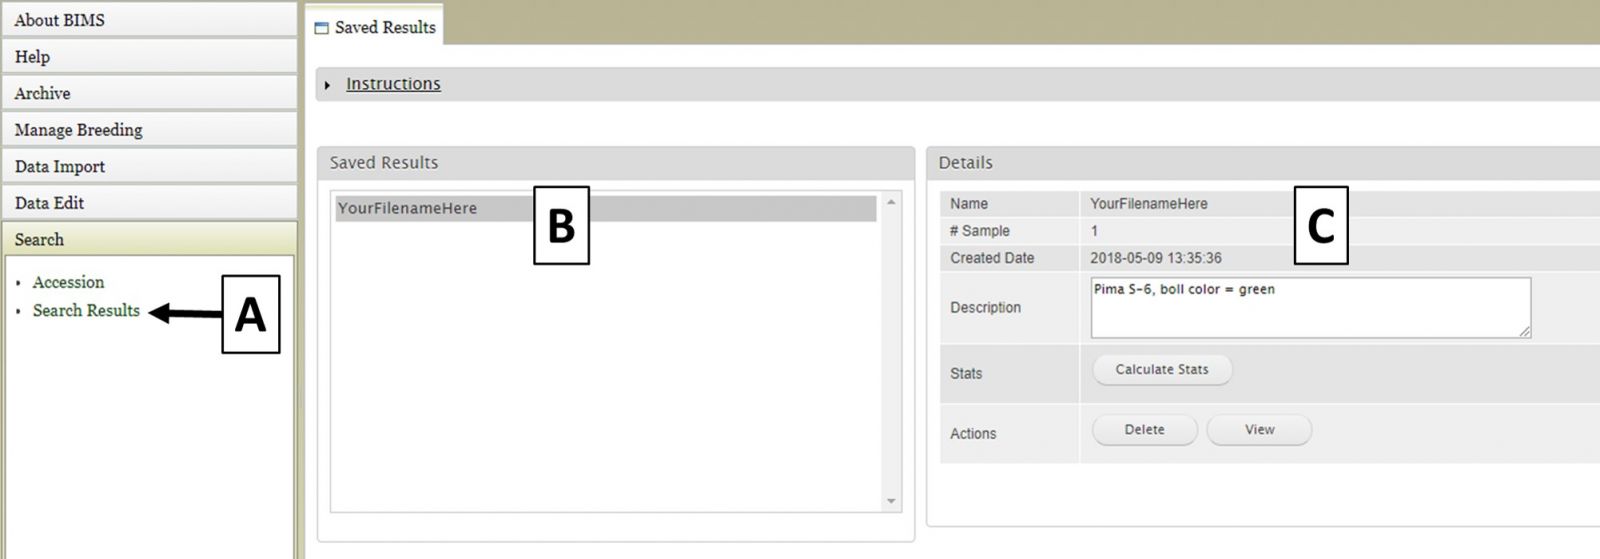
Saved search results are accessed by clicking on "Search Results" in the "Search" section of the accordion menu (Fig. 15A). Any search results you have saved will appear unded "Saved Results" (Fig. 15B) and you can also see details about the saved lists and delete, view, or edit them (Fig. 15C).
Figure 15. Accessing saved search results
BIMS: Creating a New Breeding Program
To start a new breeding program in BIMS, you must have a CottonGen account with the appropriate access level. Once you have that, select "Program" under Manage Breeding from the accordion menu (Fig. 16A). This will open the "Manage Program" tab and then you can open the "Program Admin Menu" section (Fig.16B). Click "Create" to make a new program.
Figure 16. Switching crops and opening the Manage Program tab
.jpg)
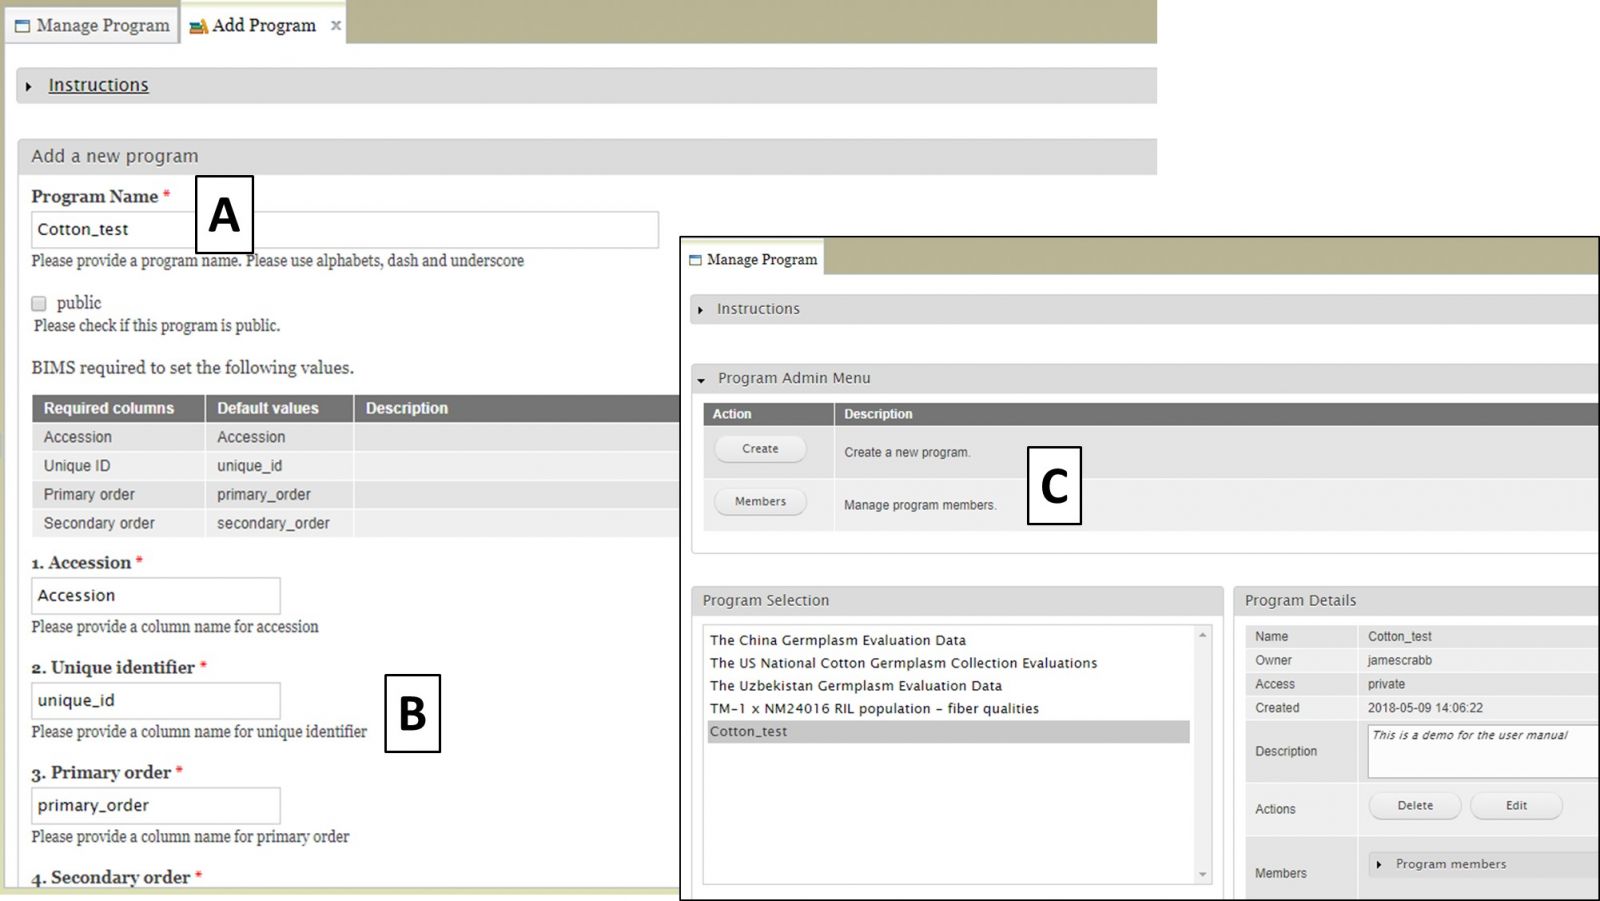
After clicking the "Create" button, the "Add Program" tab opens. Enter a new Program Name (Fig. 17A) and make sure that the required column names are set to match your dataset (Fig. 17B). These four columns are required in the phenotype sheet of the data template and if you change the column names here the column names in the phenotype sheet of the template for download will automatically change. If you use Field Book App for phenotype collection, use these column names in the input files. After you have created the program, you will have the option to add other CottonGen users as members of the breeding program (Fig. 17C). Once the program is created, data can be loaded to the program.
Figure 17. Creating a new program and adding member
BIMS: Importing Data
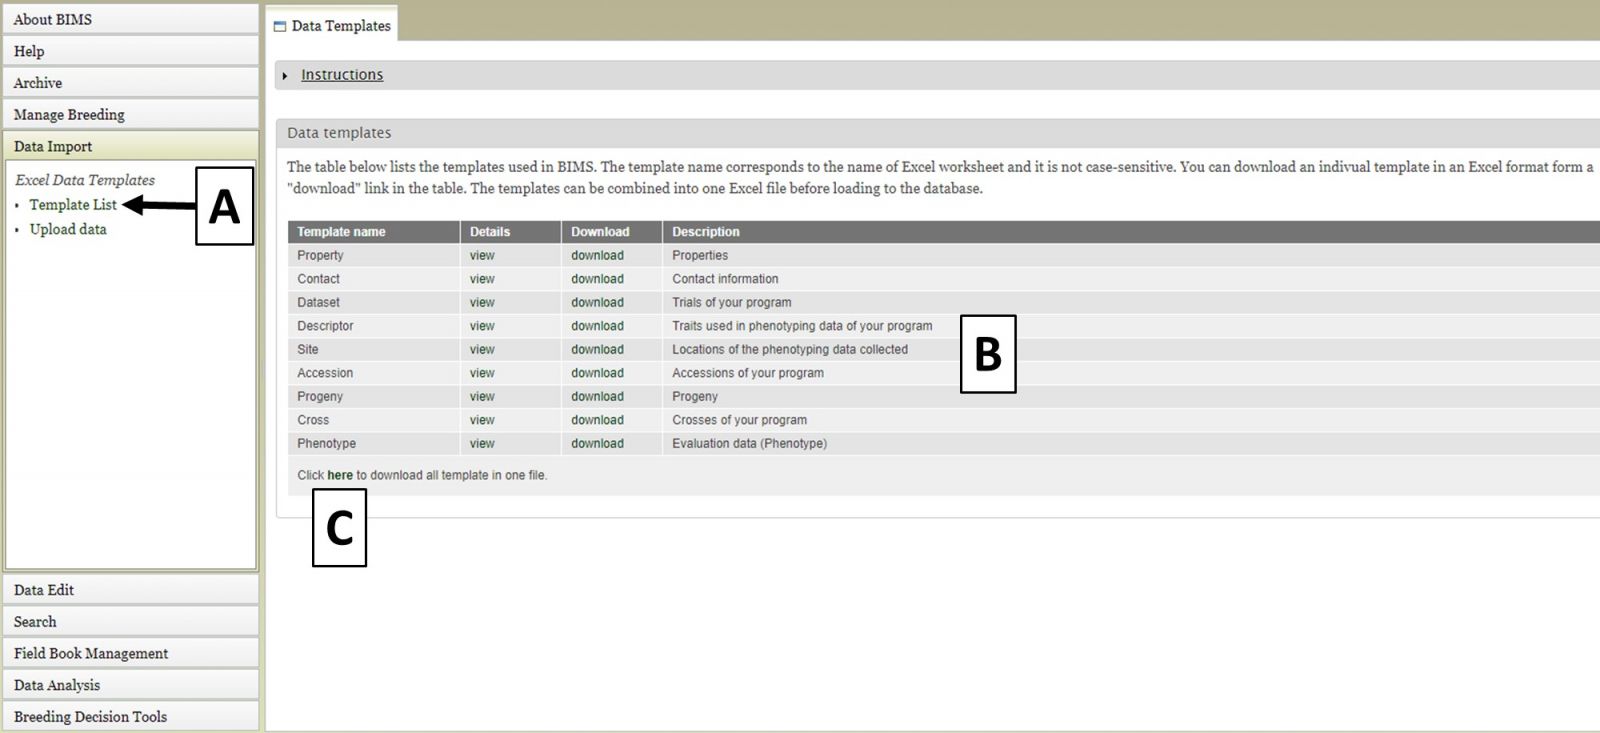
To import data into BIMS, the data need to be in BIMS templates. Phenotype data either needs to be files exported from Field Book or data entered into the BIMS templates. To download the BIMS templates, click on the "Data Import" section of the left-hand accordion menu and then click on "Template List" (Fig. 18A). You will then see the "Data Templates" tab that has information about each template and links to download the template (Fig. 18B). You can also download all the templates as a single Excel file by clicking below (Fig. 18C).
Figure 18. Downloading BIMS data templates
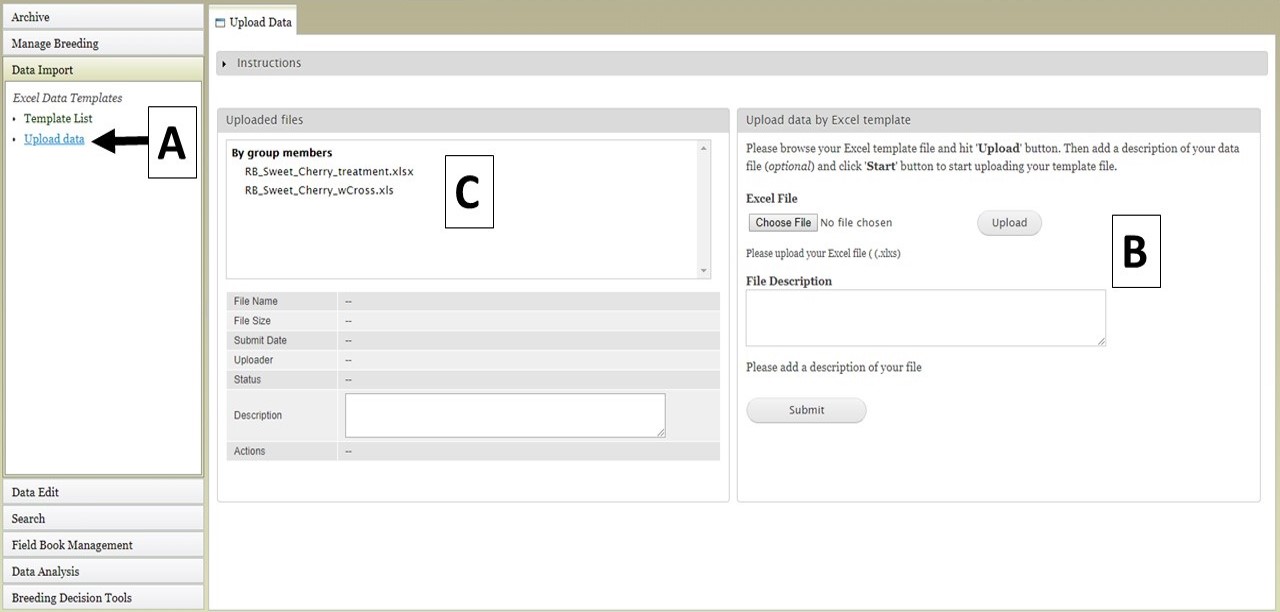
To upload data files, click on the "Upload data" link (Fig. 19A) under the "Data Import" section and the "Upload Data" tab will open. Then, under the "Upload data by Excel template" section on the right side, select the data file and click "Upload" (Fig. 19B). Enter a file description if desired, and once the file has uploaded, click "Submit". The file name will then appear in the "Uploaded Files" section (Fig. 19C).
Figure 19. Upload Data tab in BIMS
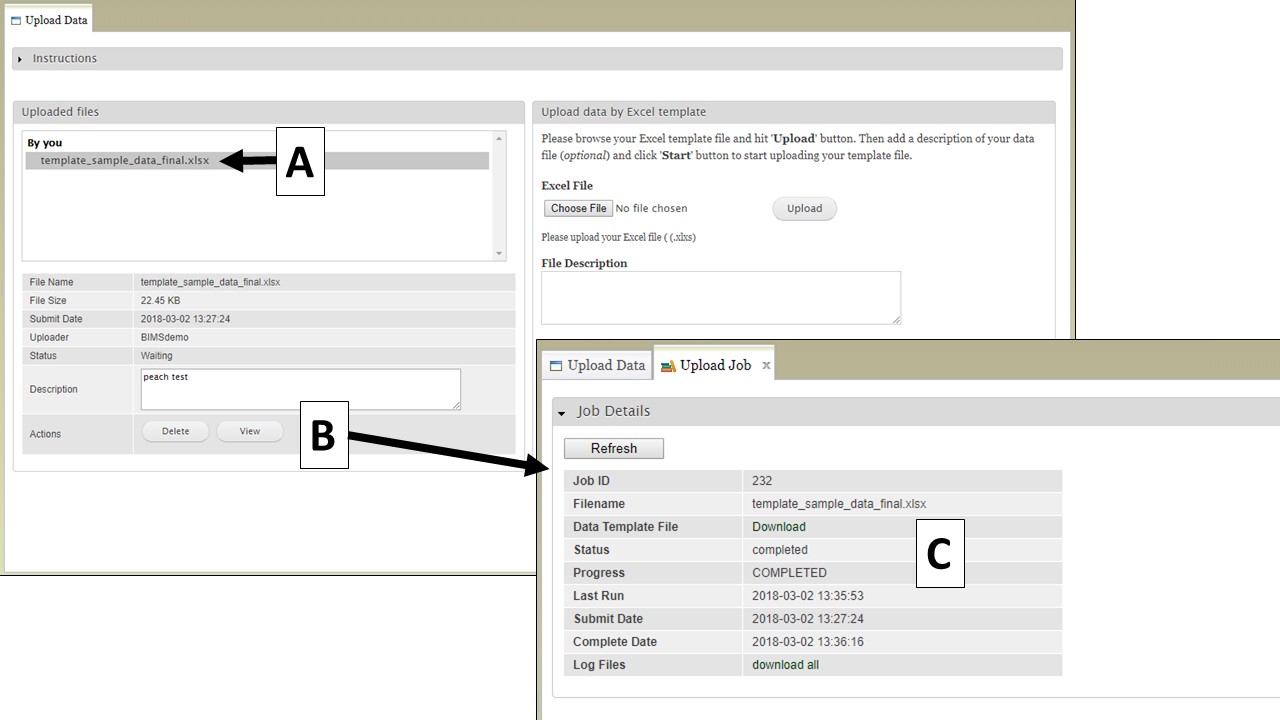
To view the progress of an upload job, click on the file name under "Uploaded files" (Fig. 20A). Summary information about the file will appear below and then click the "View" button (Fig. 20B). The "Upload Job" tab appears and will show the "Job Details" table (Fig. 20C). On the table you can see the job progress. If the job is still running, you can click the "Refresh" button to update the job progress.
Figure 20. How to view upload job progress
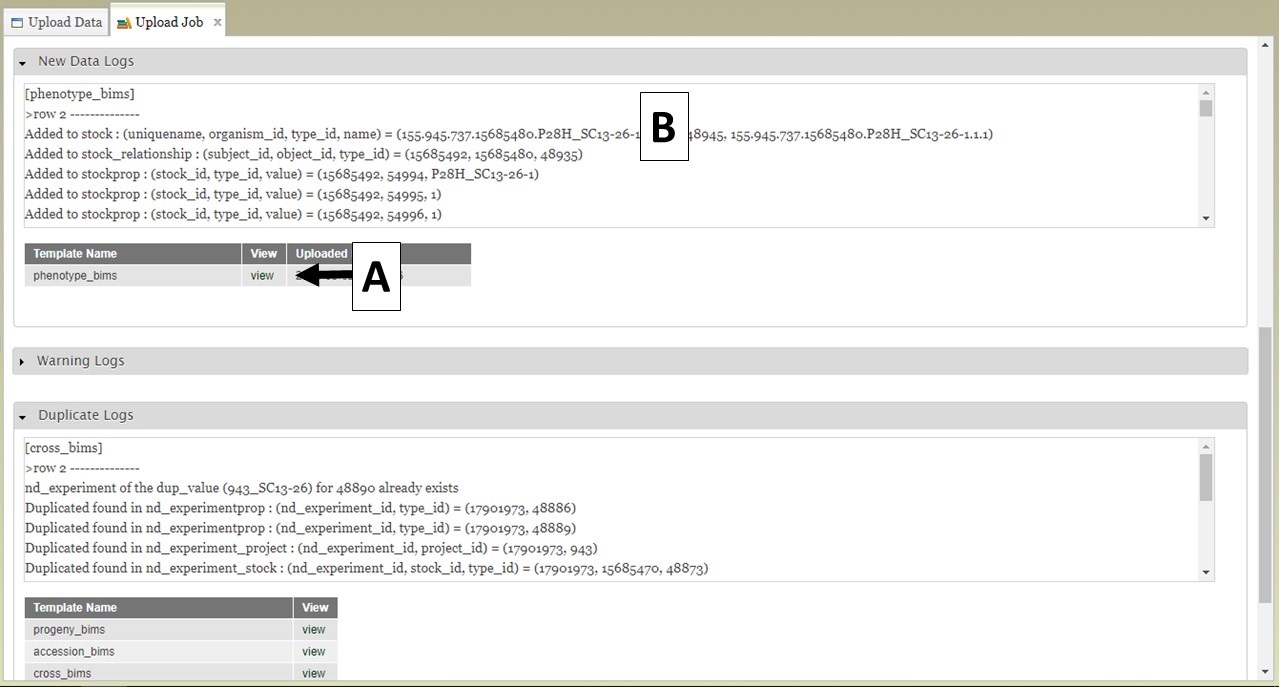
BIMS also provides links to log files on the "Upload Job" tab. When a job successfully loads, there are three types of logs: New Data Logs, Warning Logs, and Duplicate Logs. To view the logs, first expand the log type section you want to view and then click on "view" (Fig. 21A) to see the log messages (Fig. 21B). New Data Logs describe the new data that was loaded. Warning Logs indicate if any data was skipped due to incorrect column headers or typos, but this data was not critical for BIMS to load data so the job still completed. It is recommended that you look at the Warning Logs to make sure data was not omitted accidently. The Duplicate Logs display what data was a duplication of data already present in BIMS.
Figure 21. BIMS upload job logs
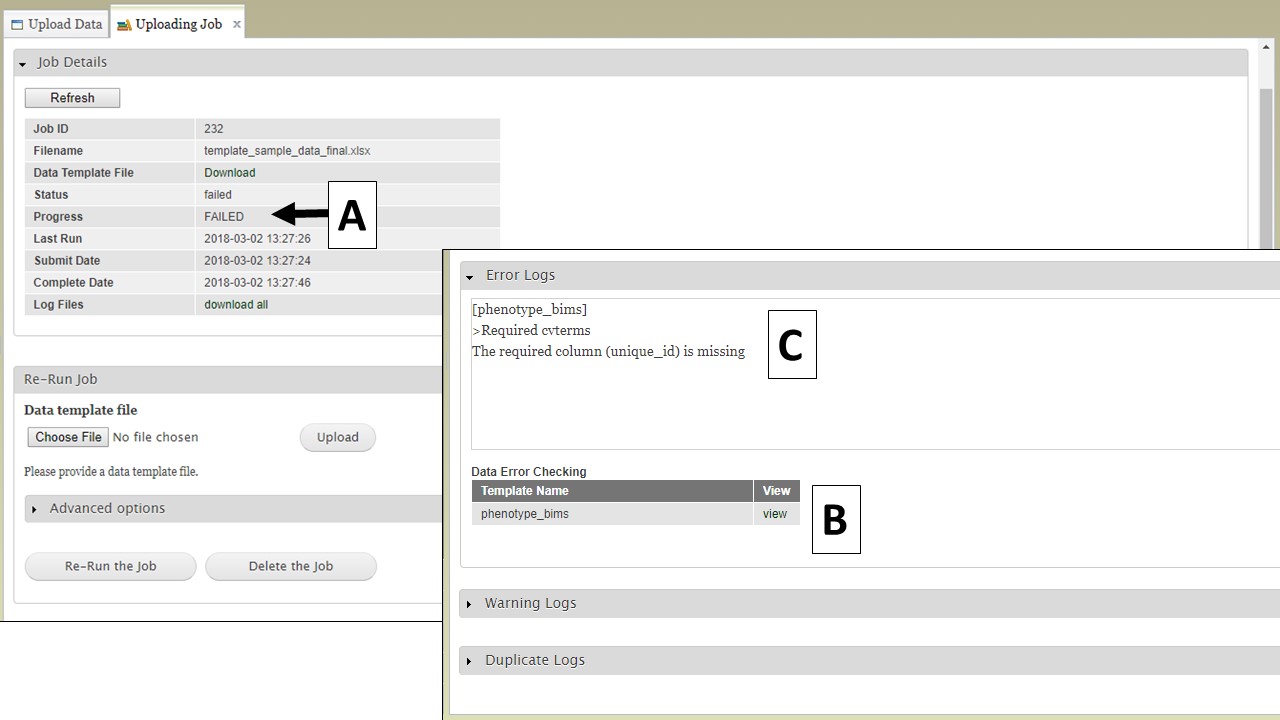
If there is an error in the data that causes the upload job to fail, you will see "FAILED" under the job progress (Fig. 22A). An Error Log section will also be available on the "Uploading Job" tab. Expand the Error Log section and click on "view" (Fig. 22B) to see the error messages (Fig. 22C). Use the Error Log information to correct the original file.
Figure 22. Failed jobs and the Error Logs
To re-run a failed job, use the "Re-Run Job" section on the "Uploading Job" tab. Select and upload the revised file (Fig. 23A) and then click the "Re-Run the Job" button (Fig. 23B). To monitor the re-run progress, click on the "Refresh" button (Fig. 23C). If the error was something that you did online, not in the template, for example you had a typo in the configuration setting, it is best not to use Re-Run Job, but go back and start the loading process again.
Figure 23. Re-running a job

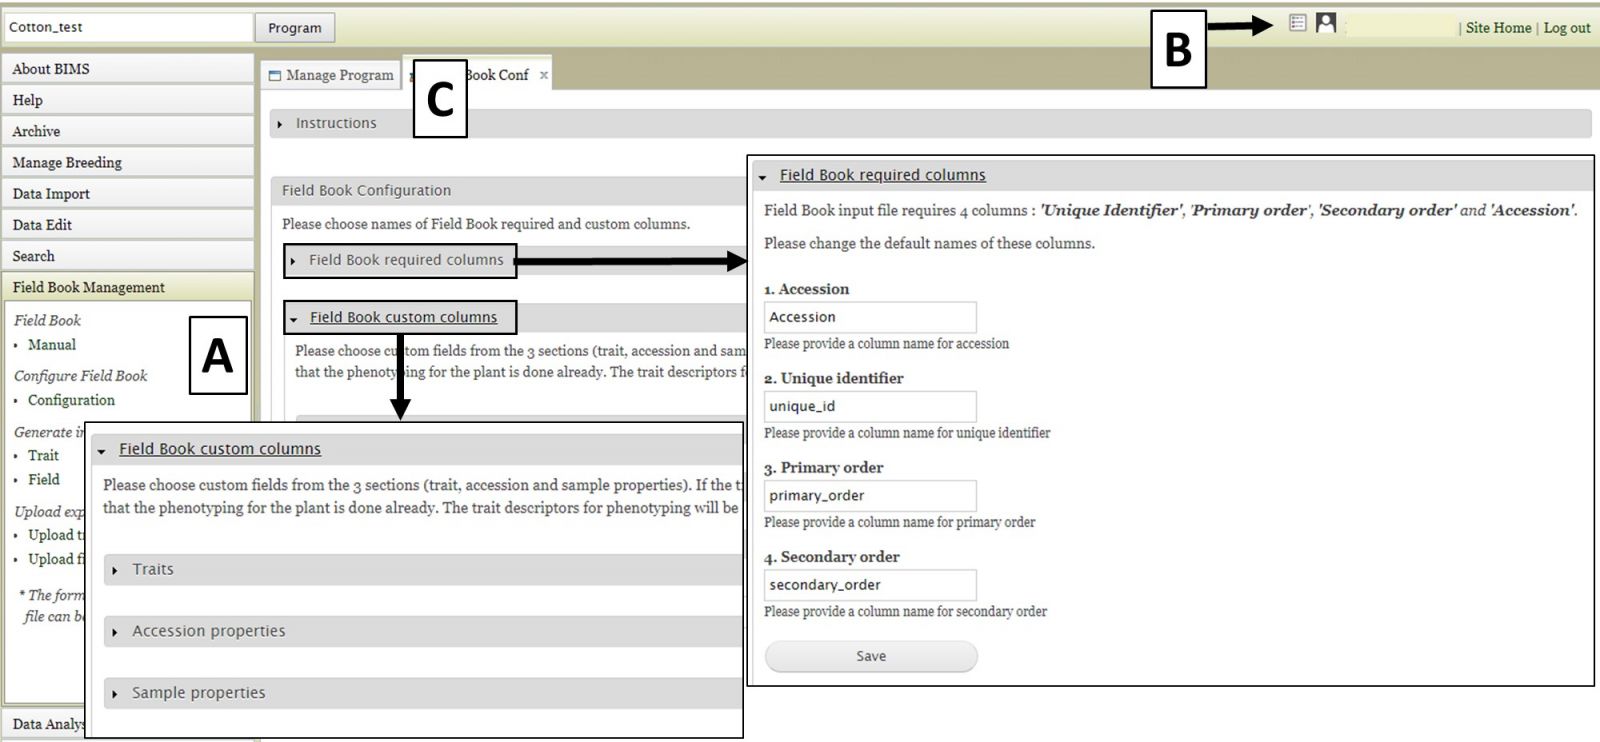
BIMS: Field Book Management
For breeders using the Field Book App, BIMS can help generate the trait and field input files to configure Field Book for data entry and BIMS can also import data in the trait and field files from Field Book. For ongoing trials, BIMS can also help breeders sync data between different devices by loading the exported data from multiple devices into BIMS and generating an input file with combined information. When breeders first create their programs, they have chosen the names for the four required columns. These columns must match the column names in the Field Book Input file. The configuration settings are accessed either by clicking on "Configuration" under the "Field Book Management" section on the left-hand accordion menu (Fig. 24A) or by clicking on the icon in the header (Fig. 24B). On the "Configuration" tab (Fig. 24C) there are two sections; "Field Book required columns" and "Field Book custom columns". The first section is to set names for Accession and the three required columns in Field Book Input file, the second section is for users to choose the optional columns that they want to add in the Field Book Input file. When they generate a Field Book Input file, these optional columns will show up for breeders to choose for each Field Book Input file that they generate.
Figure 24. Field Book configuration options
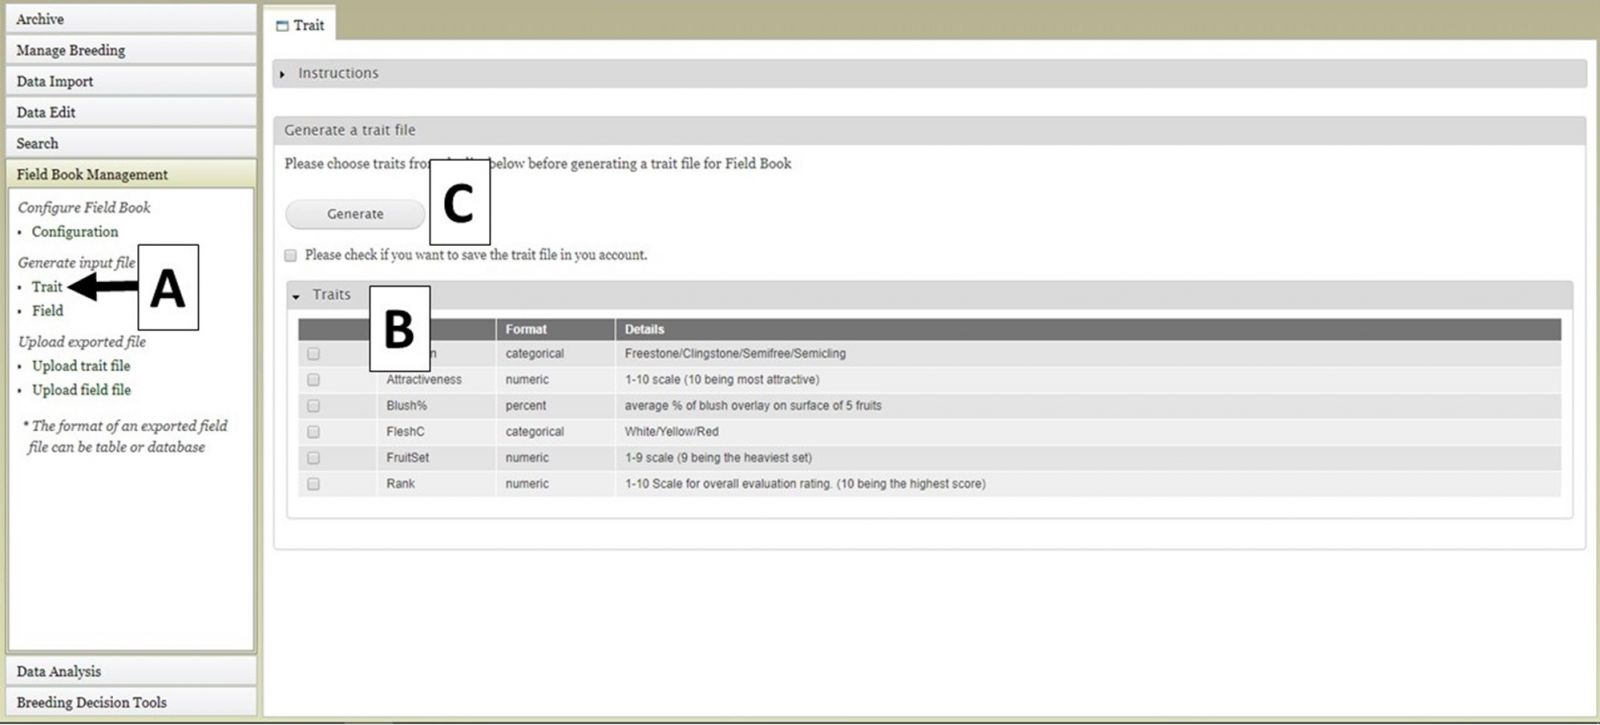
Two different file types for input into Field Book can be generated using BIMS. The first file type is the Trait (.trt) file when breeders want to add traits to Field Book using a file instead of creating them one by one in the Field Book App. This file contains the details of the phenotypic traits being recorded. To generate this file, click on "Trait" (Fig. 25A) and the "Trait" tab will open. On the "Trait" tab, there will be a list of traits that have already been loaded into the program on BIMS (Fig. 25B). Select the traits you want to export and then click the "Generate" button (Fig. 25C). A .trt file will then download.
Figure 25. Generating Trait file for Field Book
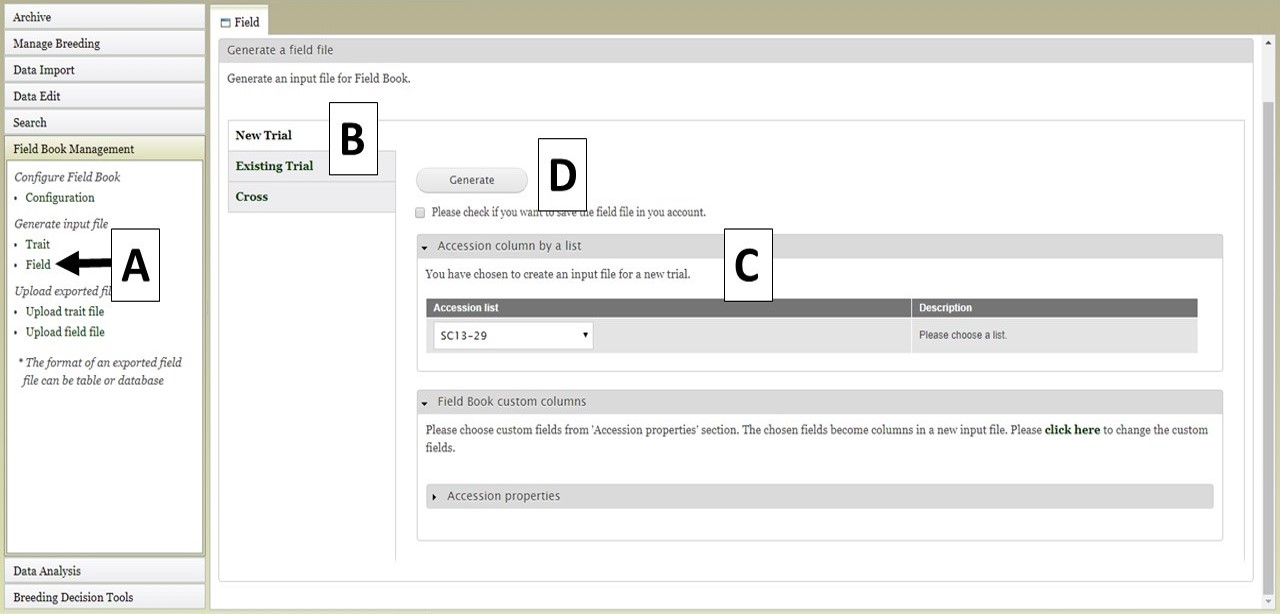
The Field file (.csv) can also be generated for import into Field Book. This file has the list of accessions and columns for the required columns (unique identifier, primary order, secondary order). The Field file is generated by clicking on "Field" (Fig. 26A) to open the "Field" tab. On the "Field" tab there are three options for generating the file (Fig. 26B). The first option is to generate a "New Trial". This can be used when breeders want to do another trail with accessions that are already in the database. If you have saved an accession list from a previous search (see Searching Data section), the option to use that list is available (Fig. 26C). You can also select other accession properties to add to the file. To generate the file, click the "Generate" button (Fig. 26D) and the file will download. In the generated file from this "New Trial" option, only the accession is provided and the three required colums (the unique identifier, primary order, and secondary order) will be empty since they depend on the planting design. The breeders should fill in those columns before importing into Field Book App.
Figure 26. Generating a Field file for a New Trial
Field files can also be generated from an Existing Trial. Files from Existing Trials (Fig. 27A) contain the accessions from the existing trial that is selected as well as the custom columns the user chooses. This functionality is to provide a way to sync data from multiple devices that have Field Book App to check which individual has been phenotyped already. Breeders can first upload the data from multiple devices, then generate an updated input file from the existing trial with a trait value.
Figure 27. Generating a Field file from an Existing Trial or Cross
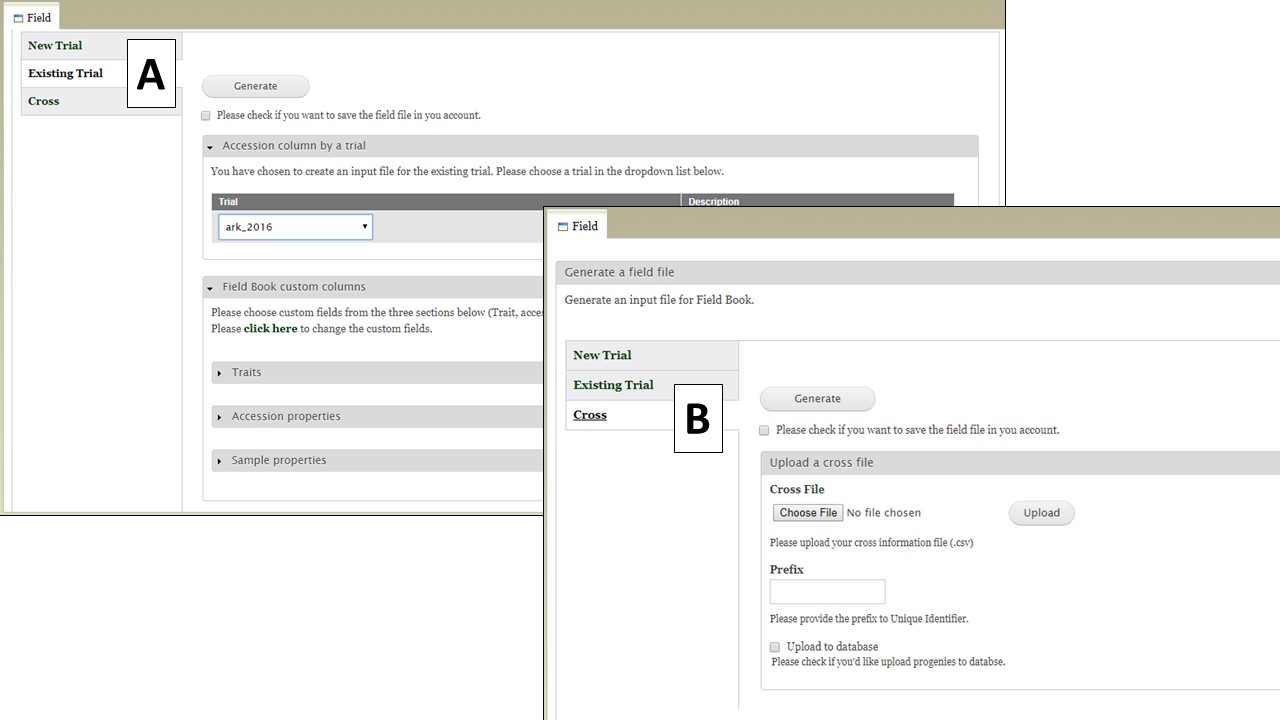
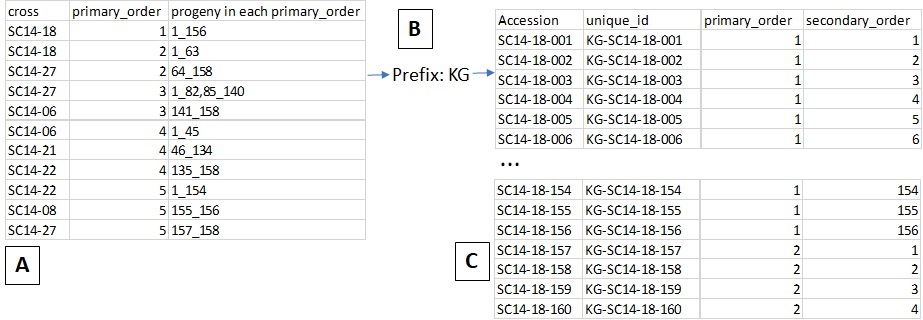
The Cross option (Fig. 28) allows you to generate an input file for a new cross. When users upload a file with information on the cross and the planting (Fig. 28A, eg. cross name, primary order, and progeny in each primary order) and type in a prefix for the unique id (Fig. 28B), then BIMS generates a Field Book input file with new progeny names and three required columns automatically filled in (Fig. 28C). In the uploaded file (Fig. 28A), the order of the columns is important, not the column head.
Figure 28. Example input file and output file for Generating a Field file for a new Cross
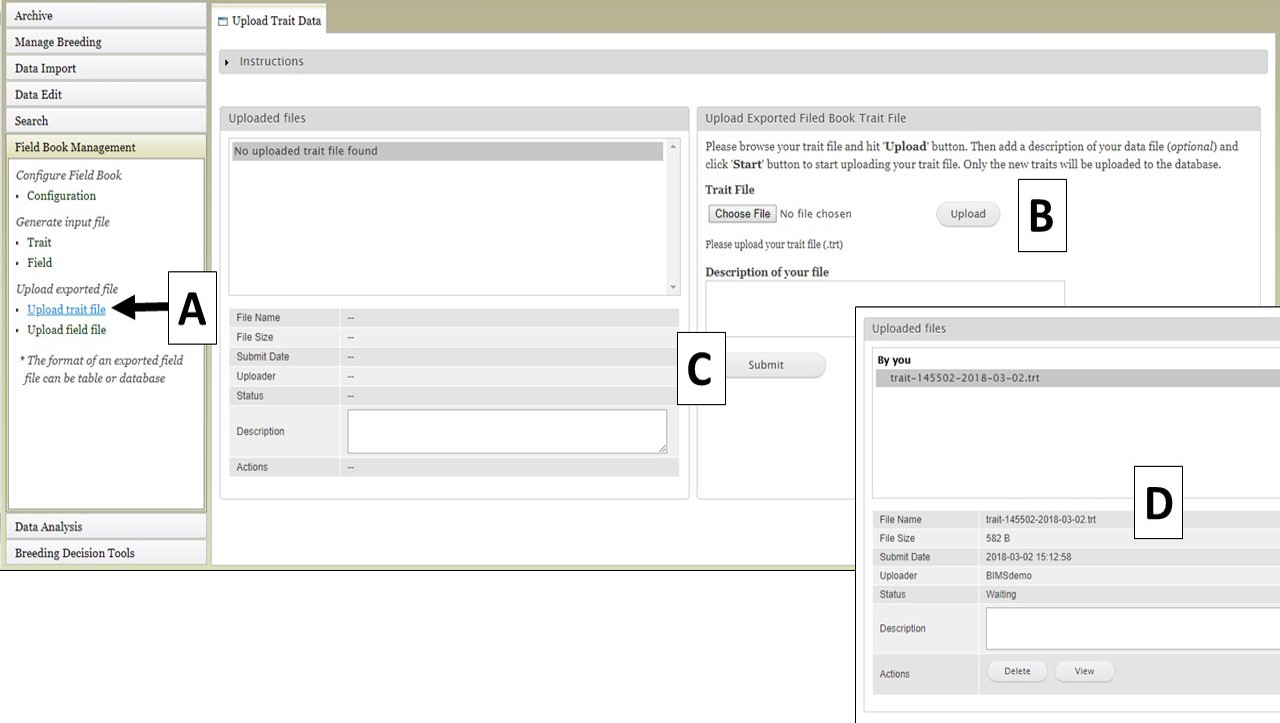
If you have already configured Field Book and would like to transfer the Trait and Field information to BIMS, that can be done by importing the Trait and Field files from Field Book. To import a Trait file, use the "Upload trait file" option (Fig. 29A). Select your file (Fig. 29B) and click "Upload." Once the file has uploaded, click "Submit" (Fig. 29C) to start the import job. The file then appears in the "Uploaded files" section (Fig. 29D).
Figure 29. Importing Trait files from Field Book into BIMS
Field files can also be imported into BIMS from Field Book. Click on "Upload field file" (Fig. 30A) and then upload the field file and click "Inspect" (Fig. 30B). After BIMS checks to see if the required columns are present in the Field file, the "Upload an exported field file" section appears (Fig. 30C) and the location and trial can be selected. The file upload job is then initiated by clicking "Submit". Successfully uploaded files will appear under "Uploaded files" (Fig. 30D).
Figure 30. Importing Field files from Field Book into BIM
.jpg)
BIMS: Archiving Data
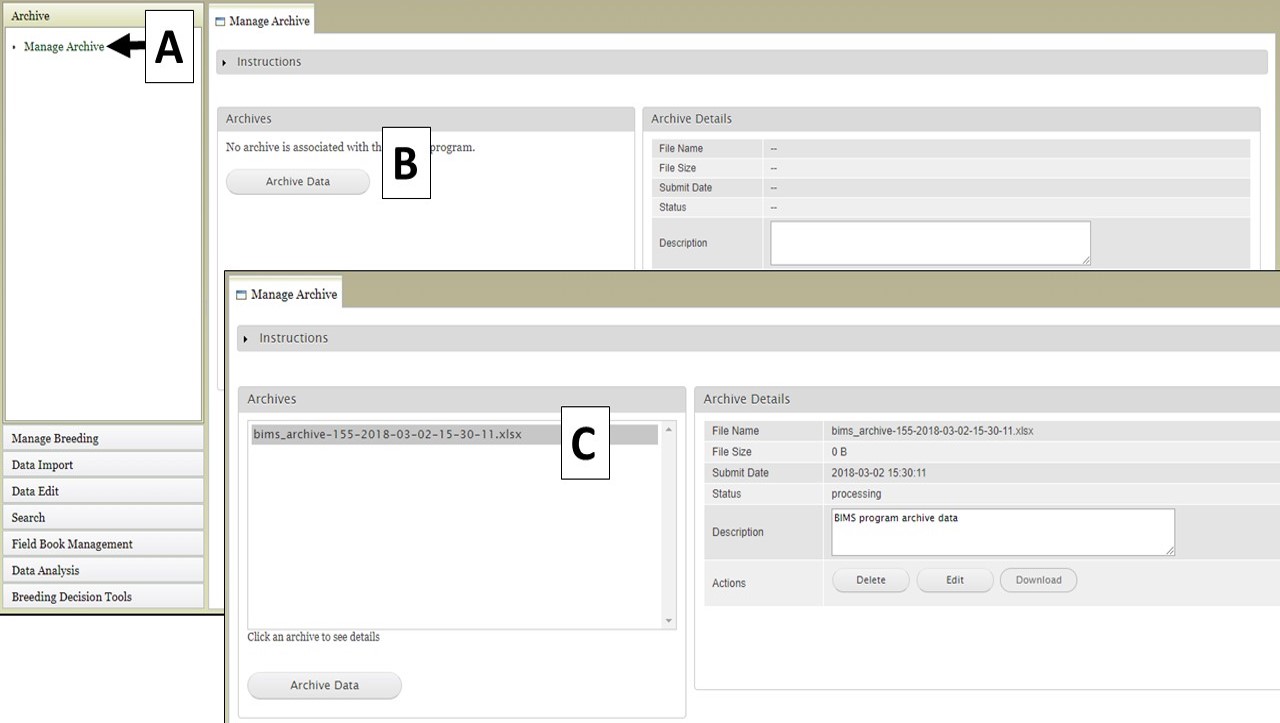
Creating an archive file of all the data in a breeding program is easily done using the "Archive" function in BIMS. Open the "Archive" section in the left-hand accordion menu, and then click "Manage Archive" (Fig. 31A). On the "Manage Archive" tab, there is an "Archive Data" button (Fig. 31B). When this button is clicked, an Excel file is generated that contains all the data in the current breeding program (Fig. 31C).
Figure 31. Generating an archive file
BIMS: FAQ and Troubleshooting
FAQ
How do I view/edit data in a program?
How do I manage Field Book trait and field files with BIMS?
How do I create a new breeding program?
Troubleshooting
| Section | Problem | Solution |
|---|---|---|
| General | I have selected a crop and program, but do not see any options under Manage Breeding and other BIMS sections. | Please refresh the page in your internet browser. |
| I still have problems with viewing BIMS information, even after refreshing the page. | Please clear the cached images/files, cookies, and hosted app data from your internet browser's history. You will have to log back into BIMS and reopen your program. | |
| Data Import/Field Book Management | My data upload failed. | Please make sure that the upload didn't fail due to data errors or typos first by looking at the error logs (see Importing Data section for more details). If you need help, contact us. |
| Even after I changed the max/min value of the trait descriptor in the template, BIMS still give an error saying that I have data outside the acceptable range. | Once your descriptor has been loaded, you have to edit the the descriptor data in BIMS, not in template (go to Manage Breeding, Trait, choose the trait and click 'Edit' .) | |
|
What do the errors below mean? The required column (unique_id) is missing |
BIMS allows you to change the column names in the template for 'accession_id', 'unique_id', 'primary_order', and 'secondary_order'. You get this type of error when the column names in your template do not match the ones in BIMS. Once you change it in BIMS, the templates downloaded from BIMS also changes. Please refer to Figure 24 in the manual. | |
| The output from Field Book Management - Generate input file (Field) - Cross option doesn't seem correct. | Please check your file if it's in the order of cross name, row and the number of progeny for each row that you will plant. In this file, the order of the columns is important, not the column head. Please refer to Figure 28 in the manual. | |
| Search | I can't download my file. | Please make sure that you allow pop-ups on your browser. Please refer to how to allow pop ups on chrome, on firefox, on internet explorer. |